10.19 Is Attention a Factor? WSB Herding, BERT Sentiment, and the Meme Confound
WallStreetBets attention factor: FF4 alpha 112.58% a year, 64.22% after GME and AMC. The three-name 20-day drift is -0.05%, t on the single name is 0.51.
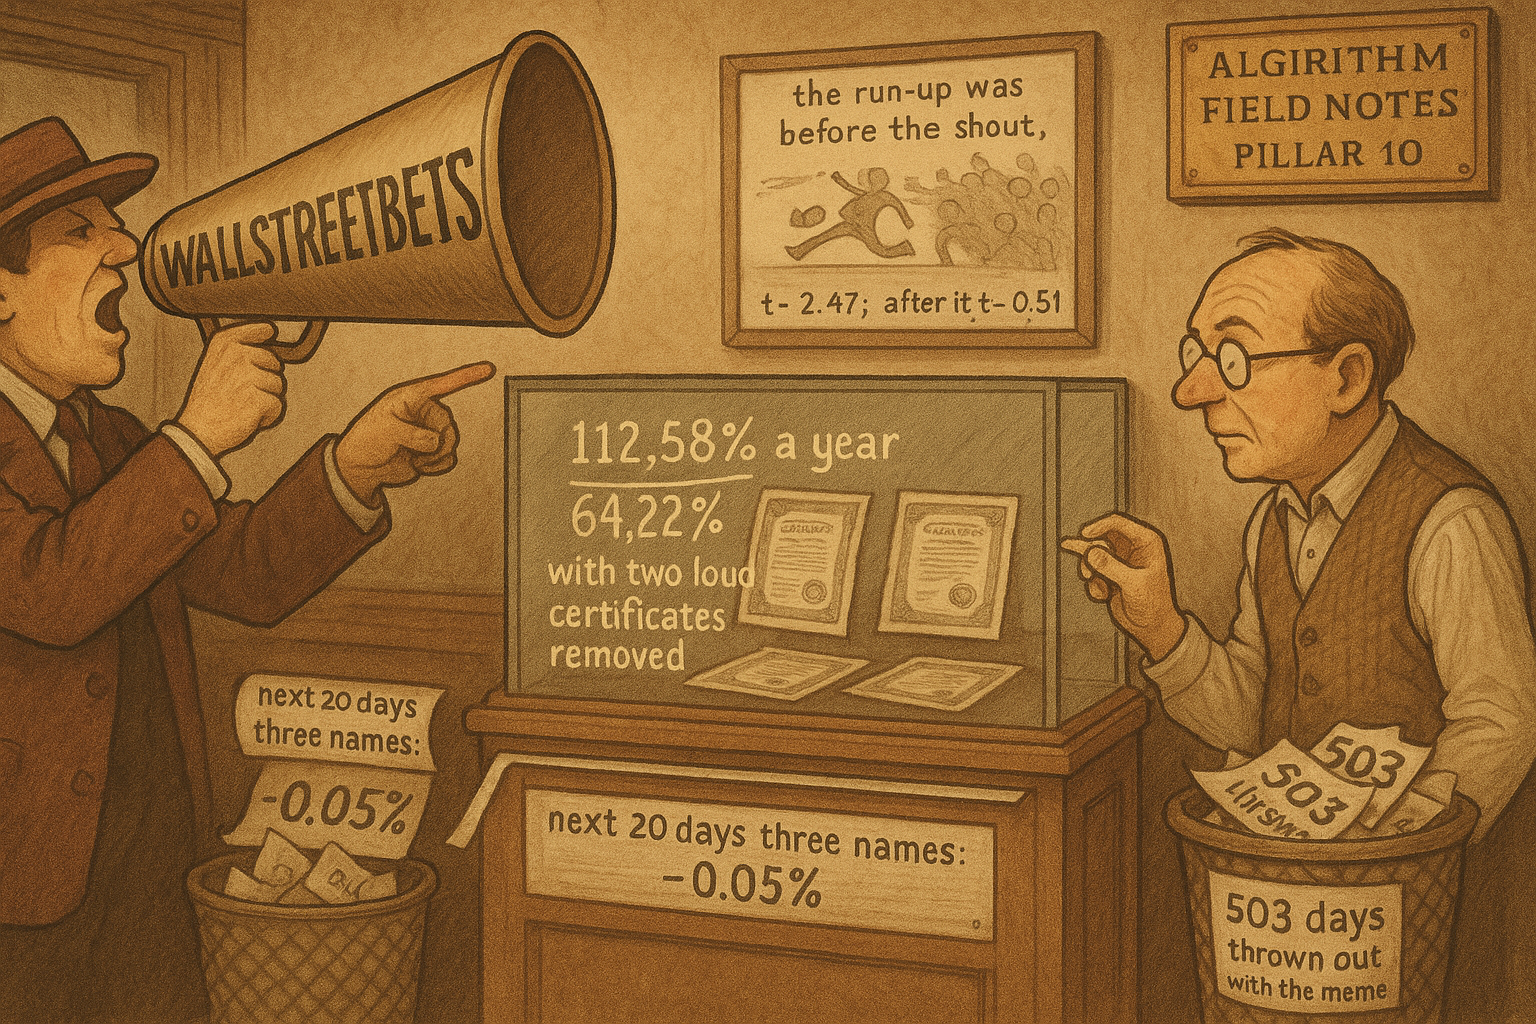
Huang and Shum Nolan buy three names. Each month they take the tickers WallStreetBets mentioned most, keep a name only when the posts were majority bullish, and hold the equal-weight book for the next month. Regress that book's daily percent return on the market, size, value, and momentum portfolios (the Fama-French-Carhart regression) and the intercept is 0.433 percent a day. Multiply by 260, which is the annualization that matches their printed figure, and the intercept is 112.58 percent a year from 2016 through 2022. Remove GameStop and AMC from the regression and the same product is 64.22 percent. The event-time cousin of this book, an equal-weight of the three loudest bullish names, has a 20-day buy-and-hold abnormal return of -0.045 percent. A characteristic ranked beside value or momentum has to show up in the window the rank leaves the book holding. The holding-period intercept and the post-event drift describe different trades.
What this actually is
You run a US equity book. Someone offers a monthly sleeve: the three tickers a Reddit forum shouted about last month, kept only when more than half the posts were bullish, equal-weighted, turned over at month-end. The pitch is a four-factor intercept of 112.58 percent a year, still 64.22 percent once GameStop and AMC are out of the regression. You need the intercept that survives once the book is three names, and once you look at the 20 days after the shout, which is the window a month-end fill earns.
The method counts posts that name a ticker, labels each post bullish or bearish with a language model retrained on retail comments, and buys last month's three loudest bullish names at the close.
Picture a bar where the same three songs get requested all evening. The bartender starts the next round because the requests arrived in a pile. Attention herding is that pile. The open question is whether the round was already paid for by the time the pile peaked. Their event study is the tab for that question, and the tab for the three-name version comes back flat.
If the intercept is a characteristic, you rank on last month's bullish mention count the way you rank on value, and you size the sleeve like any other three-name bet, with a cost line written down. If the intercept is a meme residual, you have funded a book whose leftover daily move is about 3 percent once GameStop and AMC are gone, and one name can do that in an afternoon. The old article "Alternative Data and the Short-Horizon Decay Tax" is the lease on this feed. Forum attention is short-horizon data, and short-horizon data is what the next desk copies first.
Two labels, then a fraction
A post enters the book only after two labels, and the accuracy they publish was measured on a different website's comments.
They start with 2.2 million WallStreetBets posts from 1 January 2016 through 31 December 2022. A ticker counts if users wrote it with a dollar sign, or if the word matches a real symbol and that symbol shows up with a dollar sign somewhere in the sample. Posts that name two tickers are thrown out. A language model then answers two yes-or-no questions: is the post about a trade, and if so is it bullish. They split the job in two because a wrong sign does more damage, for their purpose, than a discarded post. The model is BERT, retrained on 12,000 hand-labelled comments from Investing.com. Out of sample, on that comment style, relevance accuracy is 80 percent and sentiment accuracy is 85 percent. FinBERT, the same architecture trained on filings, scores this slang worse. A dictionary such as Loughran and McDonald counts words one at a time, and Antweiler and Frank's message-board study treated word arrivals as independent. BERT is in the paper because the next word can flip the sign. A later check with a 2023 chat model adds little accuracy, and they print no figure for it. They publish no confusion matrix on WallStreetBets text. The 85 percent is an Investing.com number.
Each surviving post carries a sign, 1 for bullish and 0 for bearish, and an upvote score equal to the maximum of zero and upvotes minus downvotes. They do not split bots from people. The feed in front of a user is the object, including whatever in it is fake. Daily ticker sentiment is the bullish share of that day's posts about the name.
$$ S_{i,t} = \frac{N^{\mathrm{pos}}_{i,t}}{N^{\mathrm{pos}}_{i,t} + N^{\mathrm{neg}}_{i,t}} $$
Read it as: N-pos is the count of bullish posts about ticker i on day t, N-neg the count of bearish posts. S is a fraction between 0 and 1. Counts divide counts, so the unit cancels. Worked example: 40 bullish posts and 10 bearish posts give 40/50 = 0.80. The monthly screen uses the same ratio over the whole month and keeps a name only when bullish mentions exceed 50 percent. A stricter cut in the event study asks for a daily average above 0.70, or below 0.30 on the bearish side. Their variable glossary once writes the cutoff as "greater than 50," next to a score that lives between 0 and 1. The figure captions use 0.50. Treat "50" as a unit slip in the glossary, and use 0.50.
Forum-wide sentiment is the same fraction over every labeled post that day. Smoothed over 20 days, it moves opposite the VIX, the S&P 500 implied-volatility index, from 2016 through 2021. In a regression they do not print, a one-standard-deviation rise in sentiment lines up with a 0.1-standard-deviation drop in the VIX. A tenth of a standard deviation is a comovement with no size attached, and the fitted line is not in the paper.
The intercept is a daily percent times 260
The portfolio question is what last month's three loudest bullish names earn over the next month, after the four standard factors.
Rank names in month t by mention count. A ticker named twice in one post counts once. Keep names with a bullish share above 0.50. Buy the top three at the close of the last session of month t, equal-weight them, and hold to the close of the last session of month t+1. They rebalance monthly, citing noise and transaction costs, and then never subtract a cost. The regression uses daily percent returns so the time series is long.
$$ R_{p,t} = a + b_{\mathrm{MKT}} \mathrm{MKT}_t + b_{\mathrm{SMB}} \mathrm{SMB}_t + b_{\mathrm{HML}} \mathrm{HML}_t + b_{\mathrm{MOM}} \mathrm{MOM}_t + e_t $$
Read it as: R sub p,t is the equal-weight return of the three names on day t, in percent. a is the daily intercept, in percent per day. The four slopes are loadings on the market, size, value, and momentum factor portfolios, which are themselves percent returns, so each slope is dimensionless. e is the residual in percent. Worked reading of their full-sample column, 1,743 days: a = 0.433, market loading 1.283 (t = 17.76), size loading 1.072 (t = 5.47), value loading -0.259 (t = -2.27), momentum loading 0.082 (t = 0.86). R-squared is 0.177, so 82 percent of the daily variance sits outside the four factors. That is what a three-name book looks like.
They annualize by multiplying the daily intercept by 260.
$$ a_{\mathrm{ann}} = 260 \times a $$
Read it as: a is percent per day, 260 is a day count, and the product is percent per year. Worked: 260 times 0.433 = 112.58, their printed full-sample figure. Drop GameStop and the constant is 0.270, and 260 times 0.270 = 70.20. Drop GameStop and AMC and the constant is 0.247, and 260 times 0.247 = 64.22. Ending the sample in 2021, their constants 0.483 and 0.257 become 125.58 and 66.82, which they print, and the middle constant 0.284 becomes 73.84, which they do not print and which sits between those two. Times 252, the full-sample 0.433 and the ex-meme 0.247 are 109.12 and 62.24. The printed 112.58 and 64.22 match 260. Compounding the mean, (1 + a/100) to the power 260, minus 1, prints 207.52 percent and 89.92 percent. That compound stacks the mean and leaves a multi-percent daily residual out of the wealth math. Their published figures are the simple product.
The full-sample t of 4.43 on the intercept is a two-sided p-value near 0.00001. Three asterisks, under their legend, mean p under 0.001, and that star is earned. The ex-GameStop-and-AMC t of 2.79 on 1,197 days is a two-sided p-value of 0.0054 against a Student-t with 1,192 degrees of freedom (observations minus the intercept and four slopes). That clears 0.01 and misses 0.001, and the cell is marked with three asterisks. The value loading of -0.259, t = -2.27, is marked with two asterisks; the same reading gives p = 0.023, which is one asterisk under their legend. The old article "How to Spot a Fake ML Trading Paper" is the same habit: recompute the printed number before trusting the decoration around it.
The intercept's standard error in the full sample is 0.433 / 4.43 = 0.0977 percent. Multiply by the square root of 1,743 and the residual scale is 4.08 percent a day. On the ex-GameStop-and-AMC sample the standard error is 0.247 / 2.79 = 0.0885 percent, and times the square root of 1,197 the scale is 3.06 percent a day. This treats intercept variance as residual variance over N. Factor portfolios with nonzero means push the true residual higher. A three-name book with a 3 percent daily residual can print a large intercept for a few years because one name's path is the residual.
The size loading leaves with the meme days
The question here is what the column "GME Excluded" did to the day count.
A rule that swaps GameStop for the fourth name keeps the day count. Their day count falls from 1,743 to 1,240, a loss of 503 days, 28.9 percent of the sample. Drop AMC as well and the count falls another 43 days, to 1,197. Ending in 2021 removes 251 days, 1,743 minus 1,492, which is a full year of sessions. Inside that split, the GameStop deletion removes 273 days from 2016-2021 and 230 days from 2022, leaving 21 days of 2022 in the ex-GameStop column. The extra 43 AMC days sit in 2016-2021, because the same 43-day gap appears in both panels. The column header says "GME Excluded" and never says the fourth name enters. The observation count is what deleting those days produces. Read 70.20 percent and 64.22 percent as the intercept on days the deleted name was absent from the top three.
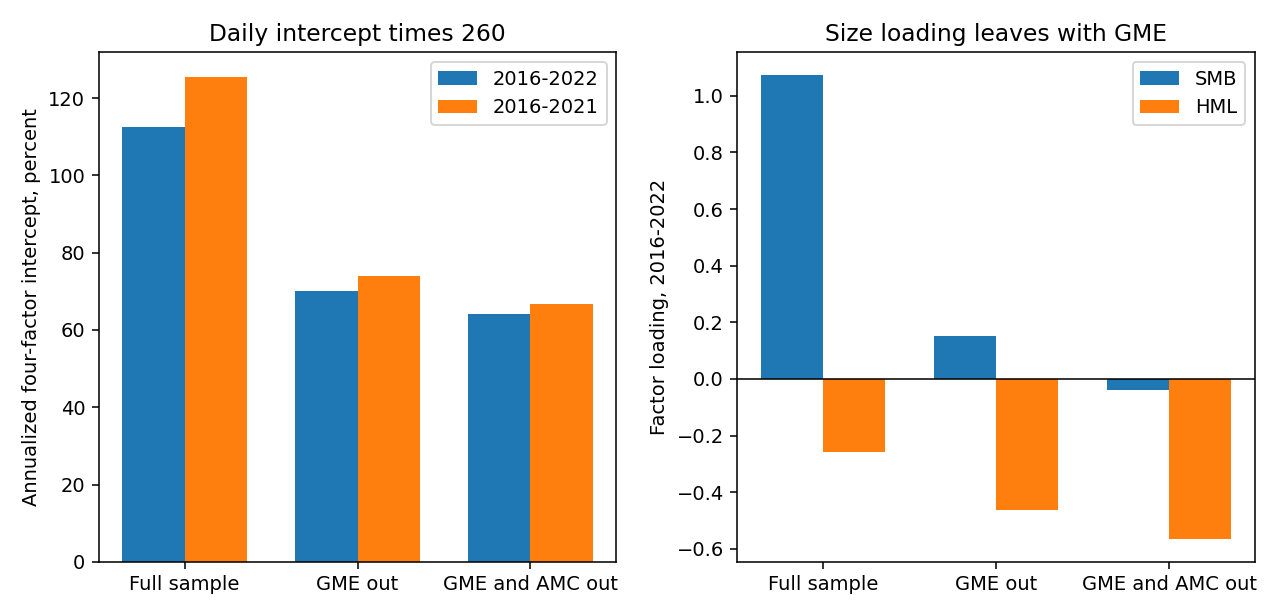
The left panel is their intercepts. The right panel is the size loading. Size loading goes from 1.072 (t = 5.47) to 0.151 (t = 0.92) without GameStop, and to -0.039 (t = -0.26) without GameStop and AMC. The value loading goes from -0.259 to -0.463 to -0.564, and the last of those has t = -3.78. Momentum stays insignificant in every column of the main panel (t = 0.86, then -0.58, then -1.53). Market loading stays near 1.3. What remains is a high-beta growth book with an intercept of 0.247 percent a day, on a sample that skipped the days the meme names were the forum's topic.
The bearish twin, top three names by attention with majority-negative posts, prints one column three times, because GameStop and AMC never sat in that book. The constant is -0.106 percent a day, t = -1.49, a two-sided p-value of 0.14. Apply their 260-day rule and that constant is -27.56 percent a year; they do not print the annualized figure, so -27.56 is the product, not a number from the table. The bearish book does load on market (1.119), size (0.778), and momentum (-0.319, t = -3.88). R-squared is 0.289, higher than the bullish book's 0.177. They point at Avila, Martineau, and Mondria on an optimism bias in social-network retail, and at Robinhood's ban on short sales, to explain the weak bearish intercept. A characteristic is a spread. They never report bullish attention minus bearish attention. With a short-leg t of -1.49, that spread has no estimated price.
The 20-day window and the monthly intercept
The question here is whether the 20 days after peak attention earn the 5.35 percent a month implied by the intercept.
Their event is stricter than the monthly book. A name has a complete attention day if, between midnight and 3:30 pm Eastern, it ranks first in post count and first in upvotes. During the Robintrack window, May 2018 through August 2020, that rule fires 305 times across 125 tickers, 207 bullish days and 98 bearish days. Robintrack is the public series of how many Robinhood accounts held each stock. They prefer a post count to Google search volume, the attention series in Da, Engelberg, and Gao, because that index is rescaled when the window updates. Abnormal return, following the market-adjusted definition they take from Barber, Huang, Odean, and Schwarz, and the bad-model warning in Fama (1998), is the stock's percent return minus the market's percent return.
$$ AR_{i,t} = R_{i,t} - R_{m,t} \qquad BHAR_{0,T} = \prod_{t=1}^{T} (1 + AR_{i,t}) - 1 $$
Read it as: R is the stock's simple return, R sub m the market's simple return. Use decimals inside the product and percent in their table. AR is a difference of returns, same units as R. BHAR is the compounded abnormal return over the window. Worked illustration with round numbers: day 1 the stock is up 2 percent and the market is up 1 percent, so AR is 1 percent; day 2 both are up 0.5 percent, so AR is 0. The product form gives 1.01 times 1.00, minus 1, which is 1.00 percent. Their table caption writes BHAR as the product of one plus AR minus the product of one plus the market return. On the same two days that second product is 1.01 times 1.005 = 1.01505, and 1.01 minus 1.01505 is -0.505 percent. If AR is already market-adjusted, the caption removes the market a second time. The printed cells cannot be recomputed from here. Keep the cells, and flag the caption as a possible wording error.
On the single loudest bullish name, the run-up from 10 days before the event to the event close is a BHAR of 9.65 percent, standard error 3.91, t = 2.47. The 20 days after the event, in the winsorized table, are a BHAR of 1.4268 percent, standard error 2.7713, t = 1.4268 / 2.7713 = 0.51. A 95 percent interval is 1.4268 plus or minus 1.96 times 2.7713, which runs from -4.00 percent to 6.86 percent. Zero sits inside it. Barber, Huang, Odean, and Schwarz report -4.7 percent over 20 days on their Robinhood herding rule. That figure sits 2.21 standard errors below 1.4268, outside the interval above. Account holdings do jump: user change on the event day averages 2,334 accounts, standard error 757, t = 3.08. The spillover into Robinhood is in the holdings. The subsequent abnormal return is a point estimate inside a wide interval.
The prose quotes a post-event BHAR of 1.95 percent for the bullish sample and -0.89 percent for the bearish sample, and calls the 1.95 insignificant "per Table 4." A footnote says the winsorized BHAR is 1.42 percent and pins that 1.42 on Table 4. Table 3, the single-name winsorized panel, is the table whose day-20 cell is 1.4268. Table 4, the equal-weight of the top three bullish names, has a day-20 BHAR of -0.045, standard error 2.478. The footnote cites the wrong table. The 1.95, the 1.43, and the -0.045 are three different objects, and the -0.045 is the cell that matches the portfolio they trade. They also annualize the bearish -0.89 percent as -10.68 percent. That product is -0.89 times 12, which treats a 20-day window as a calendar month stacked twelve times. The events overlap, so the twelve months are not separate trades.
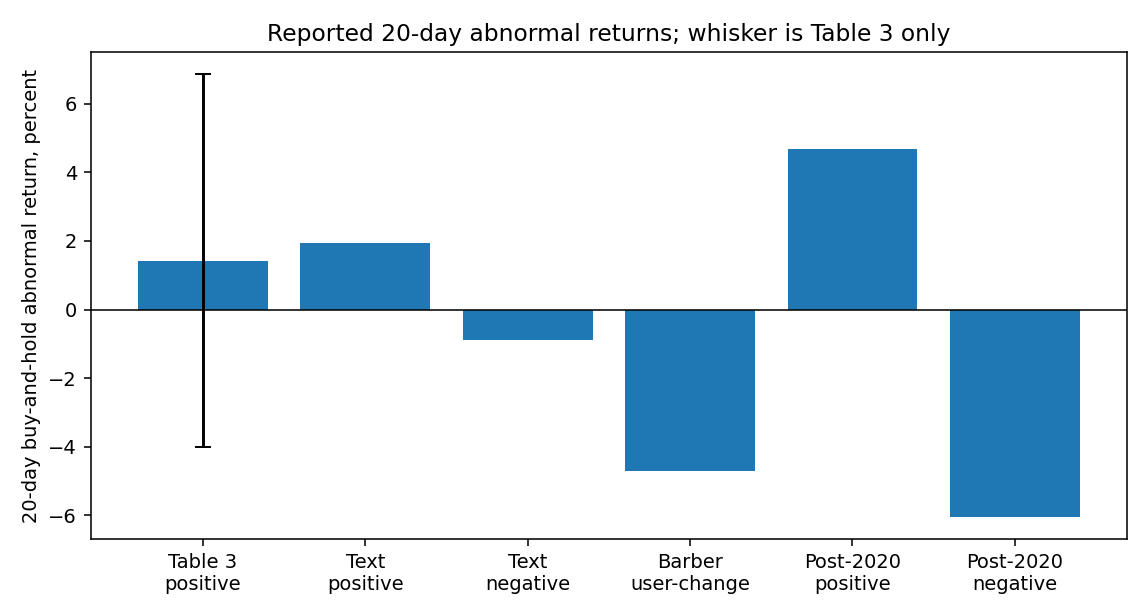
The whisker is the single standard error they print for a 20-day BHAR. From September 2020 through December 2022, with GameStop removed, they report a bullish 20-day BHAR of 4.68 percent, a peak of 8.62 percent on day 13, and a bearish BHAR of -6.05 percent. The giveback from the peak to day 20 is 8.62 minus 4.68 = 3.94 percentage points. Of those events, 155 fall in late 2020, 249 in 2021, and 325 in 2022, and 325 / 729 = 44.6 percent, the share they print. No standard error is attached to 4.68 or to 8.62.
Their monthly intercept of 0.247 percent a day is 0.247 times 260 / 12 = 5.35 percent per month under the same 260-day rule. The winsorized single-name drift is 1.43 percent over a similar horizon. The gap is about 3.9 percentage points, and the three-name event drift is -0.045 percent. One bridge would close that gap with no arithmetic error: if the same names stay in the top three next month, the holding period contains the next herd's pre-event run-up, the 9.65 percent with t = 2.47. The flat post-event window is a different object. They do not report the month-to-month repeat rate.
The sample split with Barber, Huang, Odean, and Schwarz is a definition, and it is why a reversal in their paper and a flat line in this one can both be real.
$$ \mathrm{UCR}_{i,t} = \frac{\mathrm{UserCount}_{i,t}}{\mathrm{UserCount}_{i,t-1}} $$
Read it as: user count is the number of Robinhood accounts holding stock i. The ratio is dimensionless. Barber and coauthors call a herding day the top 0.5 percent of this ratio. Worked example: an account count that goes from 100 to 200 is a ratio of 2.00 and a change of 100 accounts. A count that goes from 100,000 to 102,500 is a ratio of 1.025 and a change of 2,500 accounts. The ratio picks the first stock. A rank on post count picks names people already hold. Their attention sample has an average market cap of 175 billion dollars, against 2.23 billion in the Robinhood-ratio sample. 175 / 2.23 = 78. Large-cap names, 10 billion and up, are 60.57 percent of the stock-day observations and 35.44 percent of the unique names, so the same large names recur. Two names in furniture and home stores account for 9.24 percent of the observations. Average account change on their bullish event days is 2,497, against 900 in the ratio sample. Robinhood blocks short sales, so a bearish post has a weak path into account changes for a mechanical reason, and the bearish bars are where that shows.
Influencer posts are a smaller version of the same event. A user in the top 5 percent of trailing-twelve-month upvotes is labeled an influencer for the next month. A post clears the bar if its upvotes exceed that cutoff user's upvote count. In the Robintrack window they have 170 bullish names and 115 bearish names. Both groups are up under 5 percent in the 10 days before the post. Pedersen's claim is that the influencer blesses a view already moving. The pre-event gain matches that timing. After the post the paths split, then fade. A bearish post cuts the prior gain in half over 20 days, and the gain is gone by day 32. A bullish post keeps rising through day 15, and by day 40 the buy-and-hold abnormal return is back at the event-day level. A path that round-trips inside 40 days is the short-horizon lease in the old article "Alternative Data and the Short-Horizon Decay Tax".
Write the cost line they skipped
The question here is how much of 64.22 percent a stated cost removes, and the paper leaves the turnover blank so the answer has to be a bound.
Let f be the fraction of the book replaced at month-end. Selling fraction f and buying fraction f trades 2f of net asset value. Let kappa be the one-way cost in percent.
$$ c_{\mathrm{month}} = 2 f \kappa \qquad c_{\mathrm{year}} = 12 \times c_{\mathrm{month}} $$
Read it as: f is a fraction of the book, dimensionless. Kappa is a one-way cost in percent of notional. The 2 counts the sale and the purchase. The month cost is in percent of the book, and times 12 it is percent per year. Worked upper bound, full replacement, f = 1. At 10 basis points one way, kappa = 0.10, the month cost is 0.20 percent and the year cost is 2.40 percent. Against 64.22 that leaves 61.82. At 50 basis points one way the year cost is 12 percent and the leftover is 52.22. At 200 basis points one way, a squeeze-name cost on a stock far smaller than this sample's 175 billion dollar average, the year cost is 48 percent and the leftover is 16.22. Replace one of the three names, f = 1/3, and 10 basis points costs 0.80 percent a year. They never report f. Full replacement is the expensive case, and 64.22 percent is still there afterward.
Search the portfolio section for a transaction cost, a slippage number, a Sharpe ratio, or a net figure. None is there. That is red flag three in the old article "How to Spot a Fake ML Trading Paper": a gross intercept with no cost model. On this book a punitive haircut still leaves a double-digit intercept, so the missing line is a disclosure hole. The book is three names. The ex-meme column deletes 503 days. The three-name event drift is -0.045 percent over 20 days, standard error 2.478. The repeat rate that would reconnect that drift to a 5.35 percent monthly intercept is absent. Attention, measured this way, is a short-horizon description of which large names the forum is shouting about.
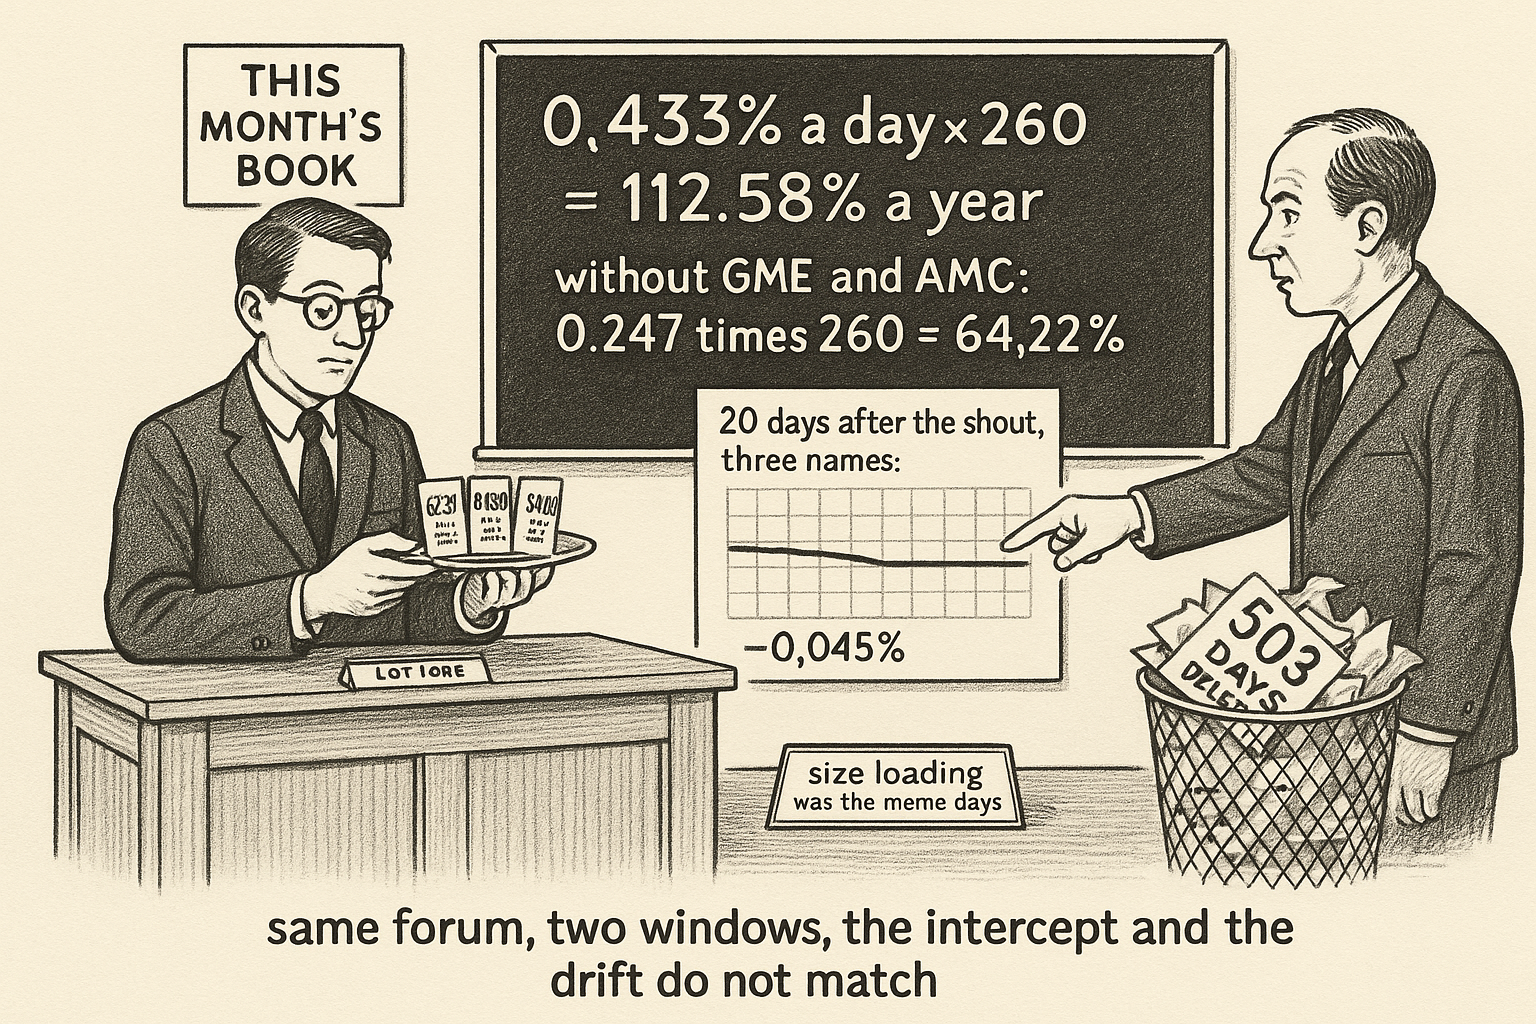
KEY POINTS
- Ticker sentiment is the bullish share of posts about the name. Forty bullish and ten bearish is 0.80. The published 85 percent sentiment accuracy and 80 percent relevance accuracy are out-of-sample on Investing.com comments, not on WallStreetBets text. The model was retrained on 12,000 of those comments.
- The four-factor intercept is 0.433 percent a day. Times 260 that is 112.58 percent a year. Without GameStop and AMC it is 0.247 percent a day, 64.22 percent a year. The ex-meme t of 2.79 is a p-value of 0.0054, which misses the 0.001 bar their three asterisks claim. The full-sample t of 4.43 does clear that bar.
- "GME excluded" drops 503 days out of 1,743. The size loading falls from 1.072 to -0.039 once GameStop and AMC are out. The value loading goes to -0.564. The bearish book's intercept is -0.106 percent a day, t = -1.49, and they never report the long-minus-short spread.
- The single-name 20-day drift is 1.4268 percent in the winsorized table, t = 0.51, interval -4.00 to 6.86. The prose says 1.95 percent. The three-name event drift, the cell that matches the portfolio, is -0.045 percent. A footnote pins 1.42 percent on the wrong table. The caption's BHAR wording subtracts the market a second time.
- Under their 260-day rule the ex-meme intercept is 5.35 percent a month. The post-event window prints 1.43 percent on one name and -0.045 percent on three. A full monthly replacement at 50 basis points one way removes 12 percent a year and leaves 52. The repeat rate that could reconnect the intercept to the pre-event run-up of 9.65 percent is not reported.
- Influencer posts arrive after a gain of under 5 percent. Bullish posts round-trip the post-event piece by day 40. Bearish posts give the gain back by day 32. That is a short-horizon path, the lease in the old article "Alternative Data and the Short-Horizon Decay Tax".