10.13 Alternative Data and the Short-Horizon Decay Tax
Alternative data buys a short-dated edge, and Dessaint shows the tax: short-horizon accuracy rises while long-horizon accuracy falls. It is a lease, not a purchase, and the crowd rents it too.
In October 2018 a firm called Thasos drew a digital fence around Tesla's 370-acre Fremont factory, leased trillions of smartphone location pings, and counted the phones inside the fence overnight. The overnight shift had swelled 30% from June to October. Its hedge-fund clients bought Tesla before the Q3 earnings report, and when the report landed the stock jumped 9.14% on a surprise profit. That is the fantasy alternative data sells: see the trucks, count the phones, read the earnings before the market does.
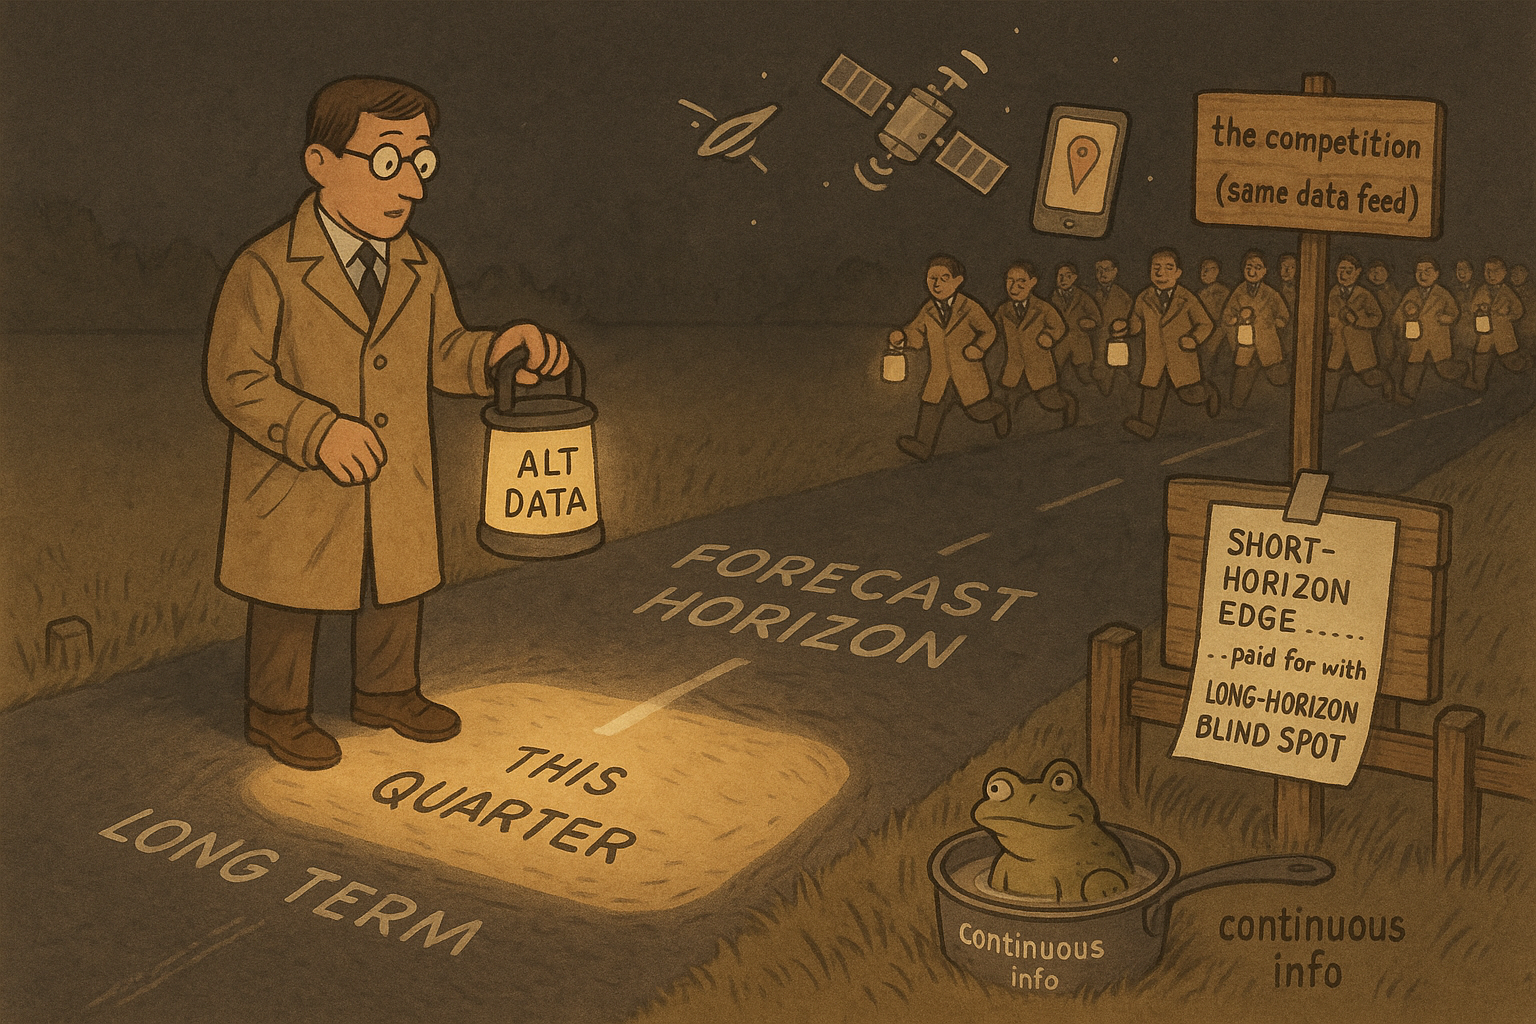
The reality has a tax attached, and this article is about the tax. Alternative data is almost entirely short-horizon information. It tells you about this quarter's phones, not the firm's ten-year cash flows. And Dessaint, Foucault and Frésard showed that when short-horizon data gets cheap, forecasters shift their effort toward the short term and their long-horizon accuracy actually falls. You buy a short-term edge and pay for it with a long-term blind spot. Worse, the short-term edge is exactly the kind that competition erodes fastest, which is the point of the old article "Alpha Decay Is Just Competition (and Papers Lie)": a signal decays because other people find it, and the cheaper and more short-dated the data, the faster the crowd arrives.
Cross-firm links: the alpha hiding in public data
Before the satellite feeds there is a cheaper cousin, what the source calls alternative-like data: information that is public and dull enough that people ignore it. The workhorse example is cross-firm links. Two firms tied by a supply chain, a shared customer, a technology overlap, or the same covering analyst tend to move together, but the lagging firm reacts late. So you build a predictor by taking a link-weighted average of the linked firms' returns.
$$ x_{i,t} = \frac{\sum_{j \in \mathcal{S}} \mathrm{LINK}_{i,j,t} \times \mathrm{RET}_{j,t}}{\sum_{j \in \mathcal{S}} \mathrm{LINK}_{i,j,t}} $$
Firm i is the focal firm whose next-month return you want to predict, S is its set of linked firms, LINK-i-j is the strength of the tie to firm j, and RET-j is firm j's current return. The numerator is the link-weighted sum of the linked firms' returns and the denominator normalizes by total link strength, so x is a weighted average return of everyone connected to you. Work it. Suppose a chipmaker has three technology-linked peers with link weights 0.5, 0.3 and 0.2, and this month they returned plus 4%, minus 1% and plus 2%. Then x equals 0.5 times 4 plus 0.3 times minus 1 plus 0.2 times 2, all over 1.0, which is 2.0 minus 0.3 plus 0.4, or 2.1%. A high linked return predicts a high focal return next month, because the focal stock has not caught up yet.
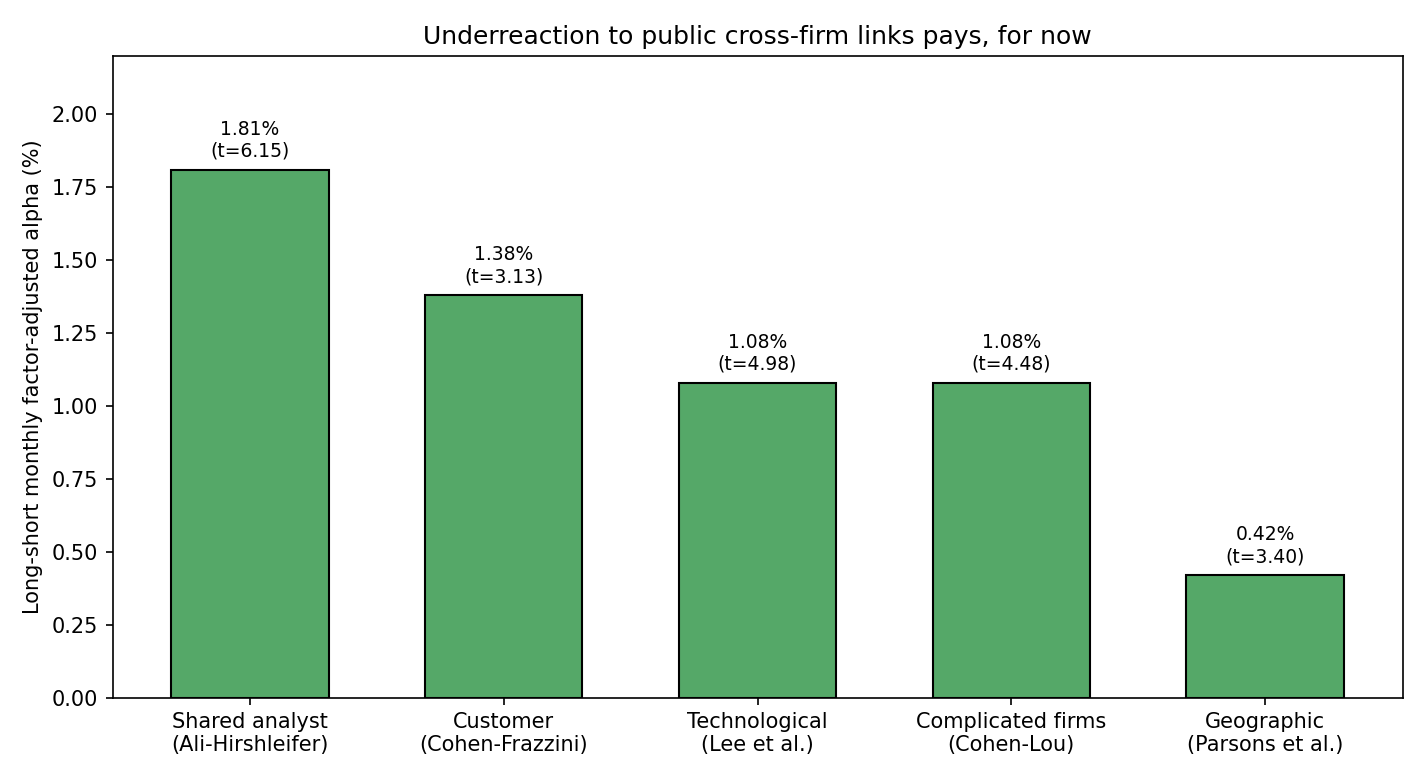
The alphas are real and they are not small. Sorting focal firms on this signal and going long the top decile, short the bottom, the four-factor monthly alpha runs 1.81% for shared-analyst links (t of 6.15), 1.38% for customer links (t of 3.13), 1.08% for both technological and complicated-firm links (t of 4.98 and 4.48), and 0.42% for geographic links (t of 3.40). Every one clears the bar. The mechanism is not risk, it is limited attention plus limits to arbitrage: the link is public, but nobody bothers to trade it until the lagging firm's own news forces the issue.
Why the edge exists, and why it is fragile
If the link is public, why does anyone leave money on the table? Because of how the information arrives. Da, Gurun and Warachka called it the frog in the pan: a signal delivered in many tiny continuous increments slips past investors, while the same signal delivered in one discrete jump gets noticed and priced. You can measure the discreteness of a linked firm's recent move directly.
$$ \mathrm{ID}_{j,t} = \mathrm{sign}(CR_{j,t}) \times (\%neg_{j,t} - \%pos_{j,t}) $$
CR-j is firm j's cumulative return over the past three months, sign of CR is plus or minus one, and percent-neg and percent-pos are the fractions of days in that window with negative and positive returns. Read what it captures. Take a stock up over three months, so the sign is plus one. If the gain came from many small up days, percent-pos is large, say 0.60, and percent-neg small, say 0.30, so ID equals plus one times 0.30 minus 0.60, which is minus 0.30, a low and continuous reading. If instead the same gain came from a single earnings-day spike with otherwise mixed days, percent-pos and percent-neg are both near 0.30, so ID sits near zero, a discrete reading. Continuous information, the low-ID frog in the pan, produces the strongest lead-lag: in the data the high-linked-return spread earns 0.98% a month (t of 4.65) for the most continuous firms versus a statistically dead 0.21% (t of 1.10) for the most discrete. The edge lives precisely where the information was too quiet to notice, which is also why it is fragile. The moment someone builds the ID screen and trades it, the quiet gets loud.
Fund-implied alpha: reading the smart money's homework
A second alternative-like source is mutual-fund holdings. If a skilled fund holds a stock heavily, that vote carries information. Define a fund's skill as the holdings-weighted average of its stocks' future alphas.
$$ S_{i,t+1} = \sum_{n=1}^{N_t^s} w_{n,t}^i\, \alpha_{n,t+1} $$
S-i is the skill of fund i, w-n is the weight of stock n in that fund, and alpha-n is stock n's future alpha. Forward, it is trivial: a fund with weights 0.5, 0.3, 0.2 on stocks with alphas of 2%, 1% and minus 1% has skill of 0.5 times 2 plus 0.3 times 1 plus 0.2 times minus 1, which is 1.1%. The clever move is to run it backwards. You observe many funds' realized skills and you want to recover the individual stock alphas that must have produced them, which is stacking the skill equation across all funds and solving for the alpha vector. The catch is that there are far more stocks than funds, so ordinary least squares has no unique solution and you fall back on a generalized inverse. Wermers and coauthors did exactly this: the top-minus-bottom decile sorted on fund-implied alpha earned 1.10% a month with a t of 3.99. The smart money's portfolio weights are a signal, if you invert them carefully.
Common flow: when everyone gets redeemed at once
Fund holdings also drag stocks around mechanically. When investors pour money into funds or yank it out, managers buy or sell their existing holdings in proportion, and these flows are not independent across funds. One dominant component drives them: the first principal component of fund-flow shocks explains over 60% of the common variation. That means a stock's sensitivity to aggregate flow is a priced risk, which you estimate with a time-series regression.
$$ R_{i,t} = a_{i,t} + \beta_{i,t}^{flow} \times \mathrm{common\_flow}_t + e_{i,t} $$
R-i is the stock's return, common-flow is the aggregate flow factor, and beta-flow is the stock's loading on it, estimated over a trailing 36 months. Here is the twist in the sign. Fund managers prefer to hold low-flow-beta stocks because those insulate them from forced fire-sale trading, so demand bids low-beta stocks up and pushes their future returns down, while high-flow-beta stocks are shunned, sit cheaper, and earn more. Dou, Kogan and Wu found the top-minus-bottom flow-beta quintile earned a CAPM alpha of 7.62% a year (t of 2.42). Common flow carries a positive risk premium, and it is invisible unless you decompose the flows.
The short-horizon decay tax
Now the tax. Comb through 26 academic papers that use alternative data, from satellite imagery to social media to employer reviews, and not one finds predictability beyond a one-year horizon. Alternative data is structurally short-dated. Dessaint, Foucault and Frésard turned that fact into a model: analysts split limited effort between forecasting short-term and long-term earnings, and when cheap short-term data arrives it lowers the cost of the short-term task, so a rational analyst pours more effort there and pulls effort away from the long term. The prediction is not that everything improves. It is that the term structure of forecast accuracy steepens.
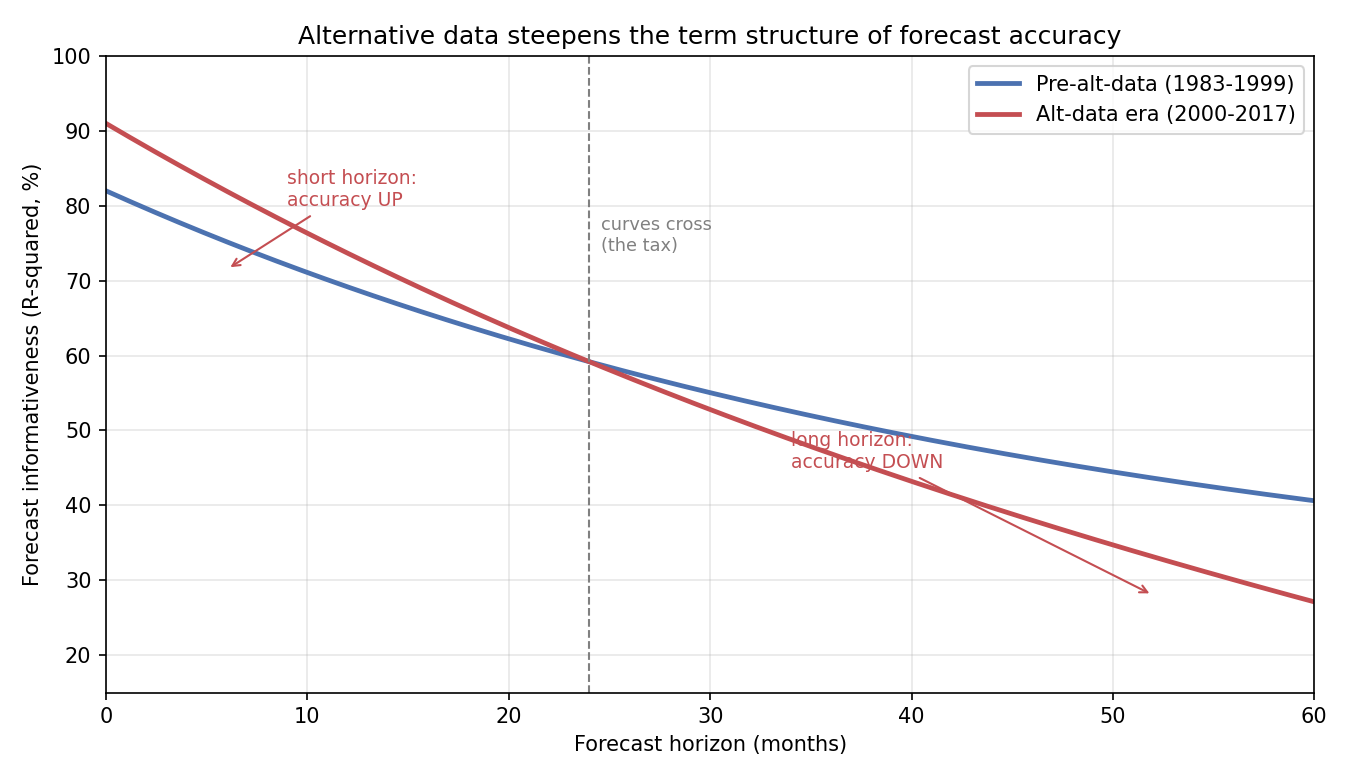
They confirmed it two ways. Over the long run, US analyst forecast informativeness rose at short horizons and fell at long horizons after 2000, exactly when alternative data began arriving. Cross-sectionally, analysts more exposed to StockTwits social-media data show the same steepening. The Chinese evidence repeats it: across 4,208,520 analyst forecasts from 2012 to 2023, short-horizon accuracy improved after 2016 while two-year accuracy significantly declined, with no change beyond two years. This is the decay tax stated precisely. The short-horizon accuracy you gain is paid for in long-horizon accuracy you lose, because attention is finite and the data only helps the near term.
Stack that on top of the crowding argument from the old article "Alpha Decay Is Just Competition (and Papers Lie)" and the picture is bleak for anyone treating alternative data as a permanent edge. A short-horizon signal is the easiest kind for a competitor to replicate, because it needs no long track record to validate, just this quarter's data feed. So the very signals alternative data is good at producing are the ones that decay fastest once the data vendor sells the same feed to your competitors. The lead-lag link alphas above are underreaction stories that survive only while attention stays scarce, and every new subscriber to the same dataset makes attention less scarce. The honest read: alternative data buys you a real but short-dated and rapidly-decaying edge, and it quietly degrades your ability to see far. Treat it as a lease, not a purchase, and never let the short-horizon signal convince you that you understand the long horizon better than you did before. You understand it worse.
KEY POINTS
- Alternative data (satellite, social media, employer reviews, search) is structurally short-horizon: across 26 studies, none finds predictability beyond one year.
- Cross-firm links are cheap alternative-like data. A link-weighted average of linked firms' returns predicts a focal firm's next-month return, earning long-short four-factor alphas of 1.81% (shared analyst), 1.38% (customer), 1.08% (technological and complicated firms), and 0.42% (geographic), all significant.
- The lead-lag edge is underreaction, not risk. Information discreteness (the frog-in-the-pan measure) shows the effect is strongest for continuous, low-discreteness information (0.98% a month, t of 4.65) and dead for discrete information (0.21%, t of 1.10).
- Fund-implied alpha reads the smart money: a fund's skill is its holdings-weighted average stock alpha, and inverting the fund-to-stock map (via generalized inverse, since stocks outnumber funds) yields a decile spread of 1.10% a month (t of 3.99).
- Common fund flow is a priced risk. Its first principal component explains over 60% of flow variation, and high-flow-beta stocks earn a CAPM alpha of 7.62% a year (t of 2.42) because managers overpay for low-beta hedges.
- The short-horizon decay tax: cheap short-term data induces analysts to shift effort to the short term, raising short-horizon forecast accuracy but lowering long-horizon accuracy. Confirmed in US data after 2000, via StockTwits exposure, and in 4.2 million Chinese forecasts after 2016.
- Short-horizon signals decay fastest because they are the easiest to replicate and need no long validation history. Alternative-data alpha is a lease, not a purchase, and it degrades your long-horizon vision while it lasts.
References
- Does Alternative Data Improve Financial Forecasting? The Horizon Effect (Dessaint, Foucault, and Frésard, 2024)
- Economic Links and Predictable Returns (Cohen and Frazzini, 2008)
- Complicated Firms (Cohen and Lou, 2012)
- Technological Links and Predictable Returns (Lee, Sun, Wang, and Zhang, 2019)
- Shared Analyst Coverage: Unifying Momentum Spillover Effects (Ali and Hirshleifer, 2020)
- Frog in the Pan: Continuous Information and Momentum (Da, Gurun, and Warachka, 2014)
- A Flow-Based Explanation for Return Predictability (Lou, 2012)
- Crowdsourced Employer Reviews and Stock Returns (Green, Huang, Wen, and Zhou, 2019)
- Alternative Data (Shi, 2024)
A note on AI. The ideas, research, analysis, and conclusions in this article are my own. I use AI tools to help with editing and wordsmithing, because English is not my first language, and I am not shy about that. AI-generated ideas and AI-assisted writing are not the same thing: the first is empty slop from a generic prompt, the second is a tool for communicating years of real research more clearly. Judge the work by its substance, not by whether software helped polish the prose.