1.27 How to Spot a Fake ML Trading Paper
Three ML trading papers report 92% and 98.7%. All three fail on their own printed numbers. Six forensic tests, one honest counter-example, and why a do-nothing model beats the headline.
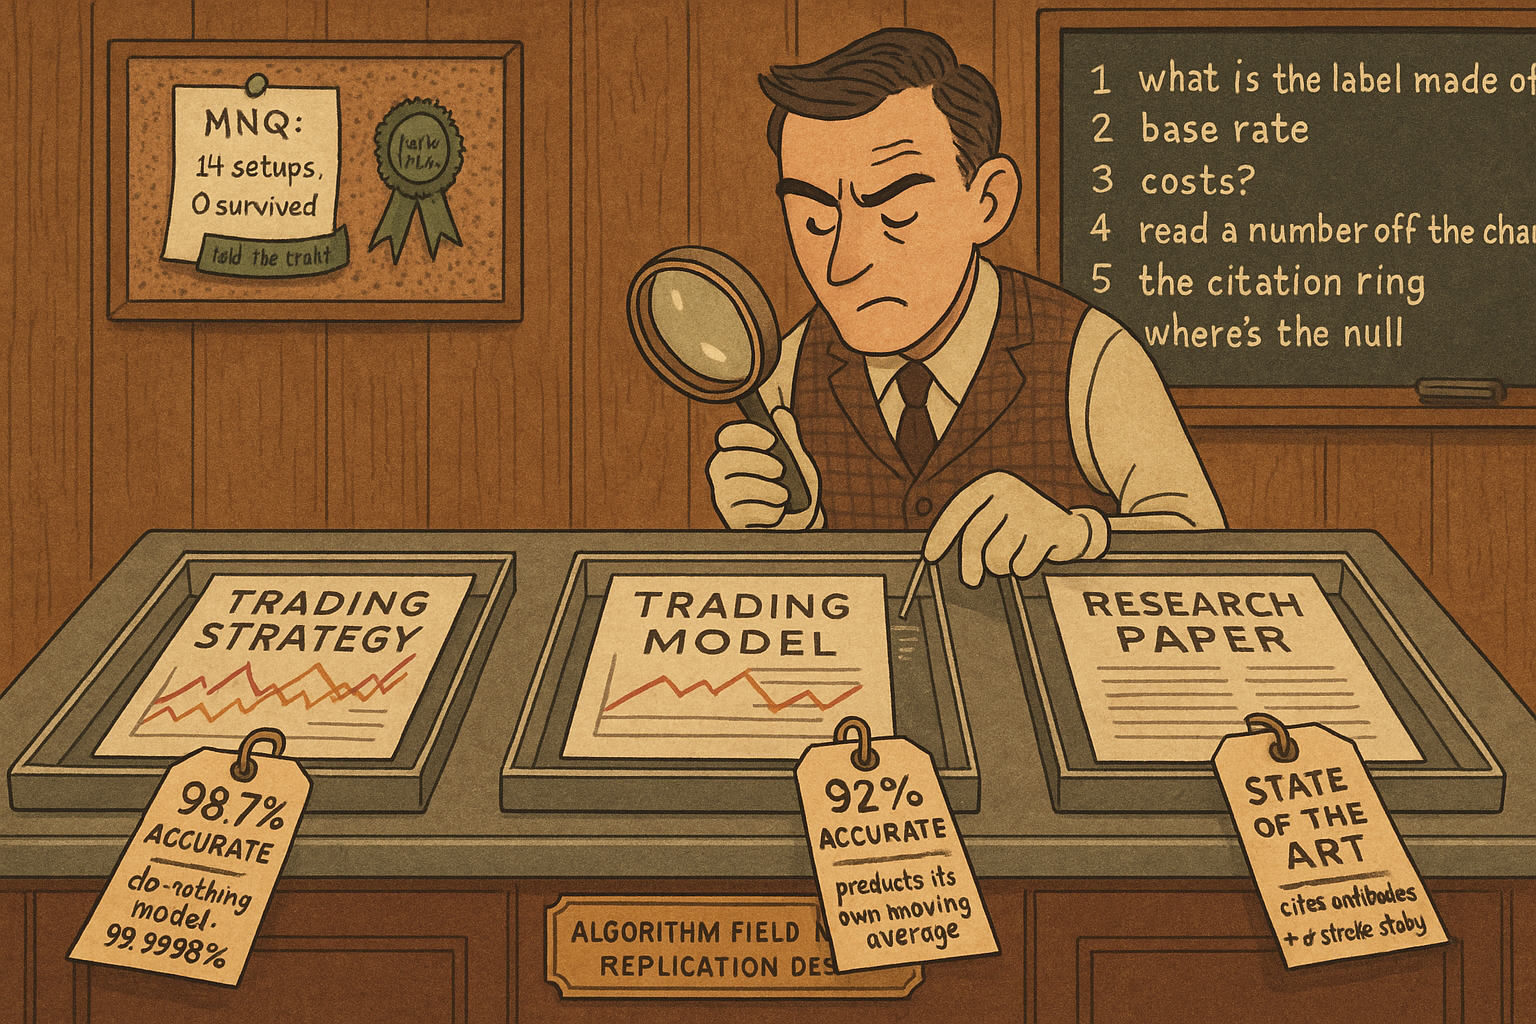
Three papers crossed my desk this month. One detects market manipulation with graph neural networks and reports 98.7% accuracy at 8.3 milliseconds per decision. A second, same author cluster, detects anomalies in high-frequency trading and reports a 15% accuracy improvement with an F1 of 0.915. A third uses XGBoost on Bitcoin technical indicators and reports 92.40% accuracy with a ROC AUC of 0.9817. All three are real, published, and citable. All three are worthless as trading evidence, and every one of them betrays itself with numbers printed in its own tables.
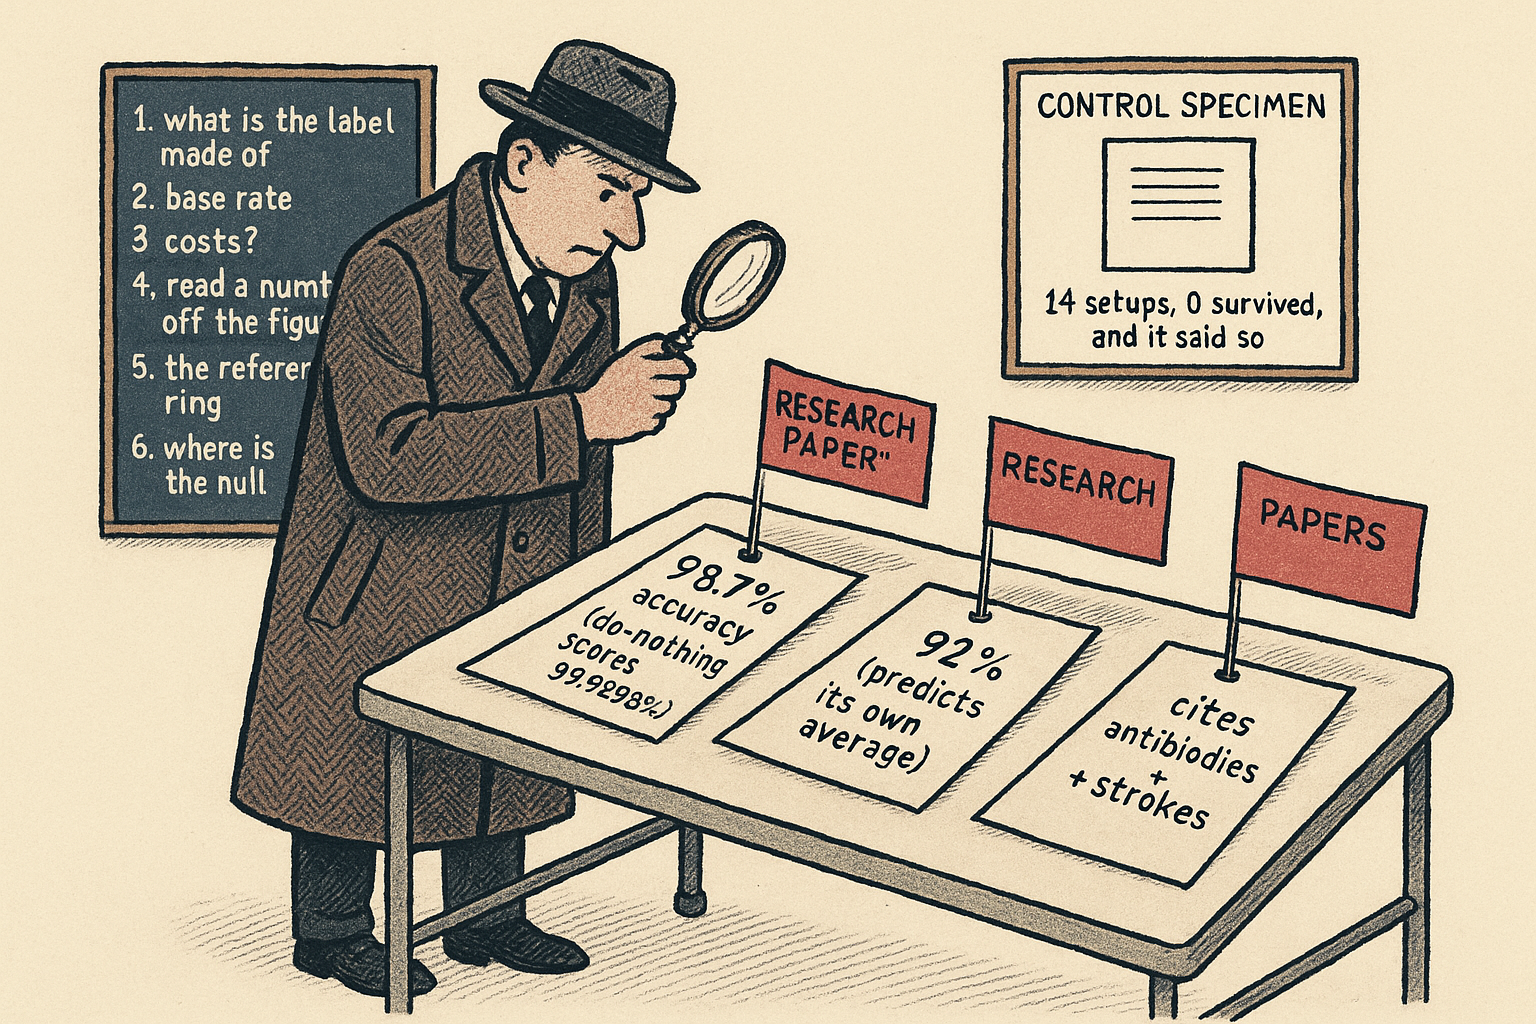
Set them next to the one honest paper in the same stack. Mathias Mesfin took fourteen popular intraday setups, wired them to next-bar fills and two points of cost on Micro Nasdaq futures, and ran an honest gauntlet across 947 days. Zero survived. That study is the subject of the old article "The Signal Ceiling: Why No Single-Bar OHLCV Edge Beats Costs in MNQ," and it is the control specimen for this field guide. The fakes report 92% and 98.7%. The honest paper reports zero. The gap between them is the whole lesson.
This is a forensic checklist. Six red flags, each with a worked number you can compute from the paper's own reported figures before you trust a single claim.
Red flag one: the accuracy measures the wrong thing
Start with the Hafid XGBoost paper because its leak is the cleanest to see. The authors build a target label with a moving-average crossover rule: buy when the 10-bar moving average of Bitcoin's close sits above the 60-bar moving average, sell when it does not. Then they feed the model features that include exponential moving averages, the stochastic oscillator %K and %D, momentum, and RSI, all computed from that same closing price. The label is a smoothed function of the price. The features are smoothed functions of the same price. The model predicts one from the other.
$$ \mathcal{Y}(t_i) = \begin{cases} 1 & \text{if } \mathrm{MA}_{10}(t_i) \ge \mathrm{MA}_{60}(t_i) \\ -1 & \text{if } \mathrm{MA}_{10}(t_i) < \mathrm{MA}_{60}(t_i) \end{cases} \qquad \text{persistence accuracy} = \Pr\!\big(\mathcal{Y}(t_i) = \mathcal{Y}(t_{i-1})\big) $$
The label is 1 when the short moving average is at or above the long one, minus 1 otherwise. The persistence accuracy is the fraction of bars where the label equals the previous bar's label, which is what a model with zero information scores by predicting "same as last bar." A crossover of a 10-bar and a 60-bar average flips rarely, so the state persists for long stretches. I simulated a 15-minute Bitcoin-like series, built the exact MA(10,60) label, and measured the no-information persistence baseline: 97.5%. That beats the paper's 92.4%. A model that ignores every feature and echoes the last bar scores higher than the fine-tuned XGBoost the paper spent nine hyperparameters tuning.
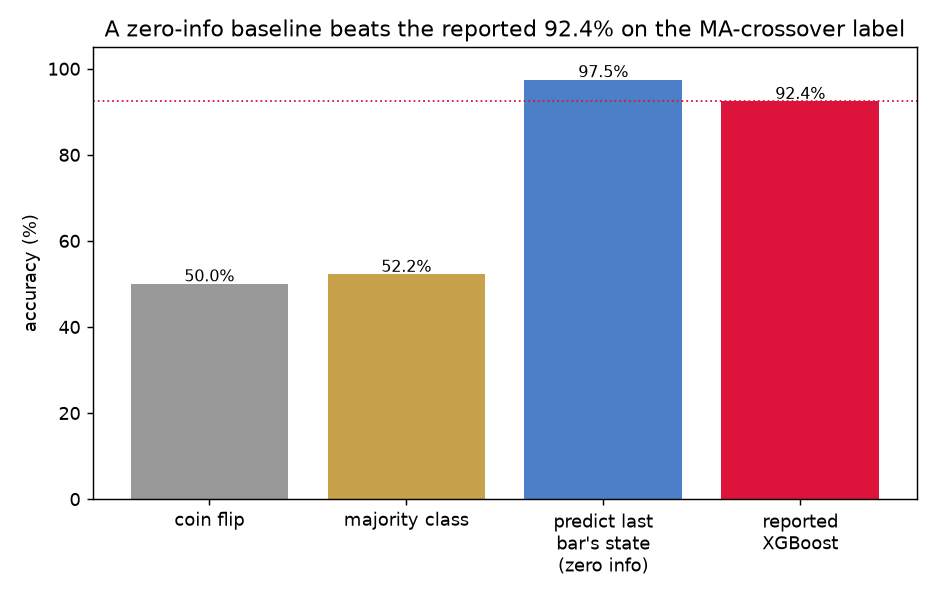
The 92% is real. It measures the persistence of a deterministic rule, not a forecast of anything you can trade. The test to run: ask what the label is a function of. If the target is computed from the same price series as the features, the accuracy is circular, and the correct baseline is not a coin flip, it is the persistence of the label itself. The old article "Technical Analysis as a Scientific Hypothesis" makes the general point: a rule is a hypothesis only when it produces a falsifiable prediction about something not already baked into its inputs.
Red flag two: an accuracy with no base rate attached
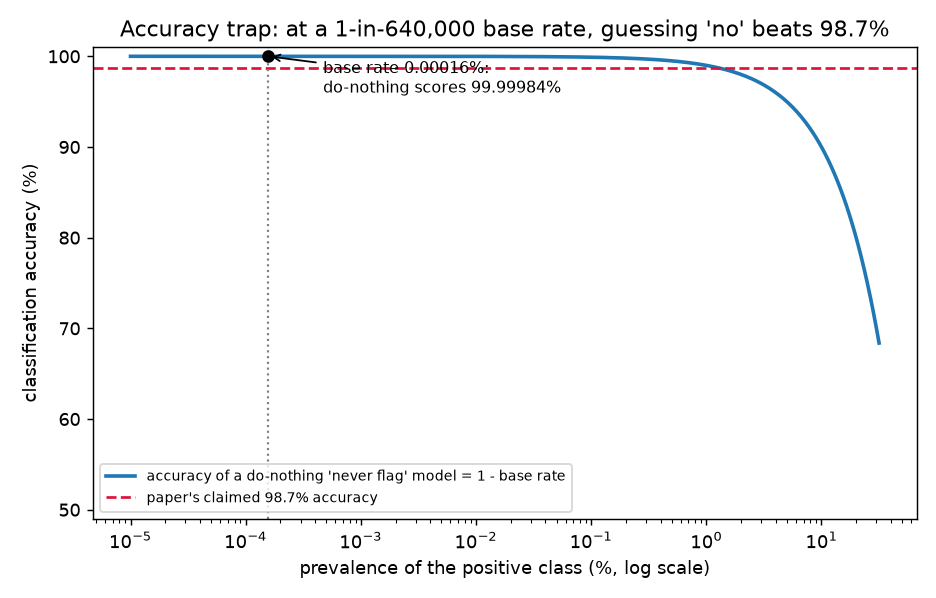
The multi-modal GNN paper reports 98.7% accuracy detecting manipulation. Its own dataset table gives you the number that kills it: on NYSE, 8.2 billion transactions contained 12,847 labeled manipulations. That is a base rate of one manipulation per 638,000 clean transactions.
$$ \text{Accuracy} = \frac{TP + TN}{TP + TN + FP + FN} \qquad \text{Accuracy}_{\text{do-nothing}} = 1 - p, \quad p = \frac{12{,}847}{8.2 \times 10^{9}} \approx 1.57 \times 10^{-6} $$
Accuracy is the share of all decisions the model gets right. A do-nothing classifier that flags every transaction as clean gets a share equal to 1 minus the prevalence of the positive class. Plug in the paper's base rate: 1 minus 0.00000157 is 99.99984%. A model that detects nothing, that is a single line of code returning "clean," scores 99.99984%, which is 1.3 percentage points above the paper's headline 98.7%. Reporting raw accuracy on a needle-in-a-haystack problem is meaningless, and worse, the paper's own number sits below the trivial baseline.
The same paper reports precision of 97.9%, and here the arithmetic gets funnier. Precision at that base rate demands an almost supernatural false-positive rate.
$$ \text{Precision} = \frac{\text{TPR}\cdot p}{\text{TPR}\cdot p + \text{FPR}\cdot (1-p)} \;\Rightarrow\; \text{FPR} = \frac{\text{TPR}\cdot p\,(1-\text{Precision})}{\text{Precision}\,(1-p)} $$
Precision is the share of flagged transactions that are truly manipulation. Solve the identity for the false-positive rate the paper needs. With a true-positive rate of 0.982, a base rate of 0.00000157, and a claimed precision of 0.979, the required false-positive rate works out to about 3.3 times 10 to the minus 8. That means fewer than one false alarm per 30 million clean transactions. No graph neural network on noisy tick data flags clean flow that cleanly. When a paper reports high precision and high recall on an extreme-imbalance problem without showing you the false-positive rate in raw counts, compute the implied FPR yourself. If it lands below one in a million, the labels or the split are broken.
Red flag three: no cost model anywhere
None of the three papers subtracts a transaction cost. Not one reports a Sharpe ratio, a profit factor, or a dollar of net P&L. They report classification metrics and stop. The old article "The Signal Ceiling: Why No Single-Bar OHLCV Edge Beats Costs in MNQ" showed why that omission is fatal on real instruments, where the entire finding was that gross edge tops out below the cost of trading it.
$$ \text{Net}_{\text{trade}} = \text{Gross}_{\text{trade}} - \text{Friction}_{\text{round-trip}} $$
Net return per trade is the gross directional move captured minus the cost of getting in and out once. Run it on the Hafid signal. The MA(10,60) label flips whenever the crossover changes state; on the paper's 15-minute cadence that is on the order of 150 to 200 round trips across the test window. Binance taker fees plus spread run roughly 15 basis points round-trip. A signal that flips 180 times pays about 27% of notional in friction over the period, and the paper never demonstrates a gross edge large enough to clear that, because it never measures a forward return at all. A directional-accuracy number that is never converted into net-of-cost P&L is not a trading result. The test: search the PDF for "transaction cost," "slippage," "Sharpe," and "net." If all four are absent, the paper has not shown an edge, it has shown a curve-fit.
Red flag four: figures that illustrate nothing
Open the anomaly-detection GNN paper's data figure and look at what it actually shows.
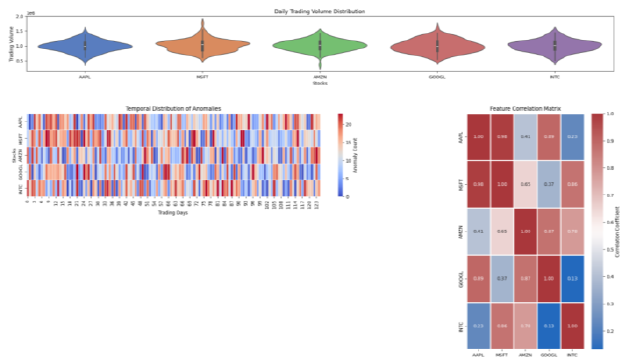
Five stocks, five violin plots of daily trading volume, all five near-identical symmetric blobs. Real trading volume is heavily right-skewed with fat upper tails; AAPL and INTC do not share a distribution shape. The anomaly heatmap beside it is a wash of uniform random color with no temporal structure, and the correlation matrix shows the tidy block pattern you get from synthetic Gaussians, not from real market features. Across all three papers the figure captions repeat the same boilerplate: "the visualization employs a hierarchical layout with color-coded components," "mathematical formulas are included," "confidence intervals around the curves." Prose describing a figure that carries no data. A real results figure lets you read a number off an axis. These let you read nothing. The test: pick one figure and try to extract a single quantity from it. If you cannot, it is decoration standing in for evidence.
Red flag five: the reference list is a citation ring
The reference lists are where the paper mill leaves fingerprints. The multi-modal manipulation paper, a study about detecting market manipulation, cites work on monoclonal antibody production, drug discovery, medical CT image captioning, P2P microloan default, and acute ischemic stroke thrombolysis in the McGill Journal of Medicine. The anomaly-detection paper's acknowledgments thank colleagues for research on IoT network traffic and cloud data-center energy optimization. The same names cycle through both author lists and both bibliographies, publishing across finance, oncology, and Kubernetes in the same year, in journals with names like the Journal of Artificial Intelligence General Science.
This is self-citation as camouflage. The references exist to inflate a citation count inside a closed group, not to build on prior manipulation-detection results, because there is no coherent prior literature being extended. The test: sample five references and check whether they are about the paper's actual topic. If a market-surveillance paper cites antibodies and strokes, the reference list is a ring, and the old article "Alpha Decay Is Just Competition (and Papers Lie)" tells you why the incentive exists: publication and citation reward the appearance of results, and nothing in the pipeline checks whether the results survive contact with a market.
The fabrication can be blunter. The Hafid paper's comparison table lists Lin et al. (2020) with an accuracy of 92.4%, the exact figure the current paper reports for itself, alongside feature names lifted from the current paper. Lin's actual reported accuracy, stated three pages earlier in the same paper's own related-work section, is 59.4%. The comparison row is copied from the authors' own result. When a paper's "comparison with prior work" hands a competitor the paper's own headline number, someone filled the table by pattern, not by reading the cited work.
Red flag six: round numbers and no null
The deepest tell is structural, and it is the one the old article "Why "Quantitative" Does Not Automatically Mean Scientific" is built around. A scientific result states a null hypothesis, a benchmark, and a rejection threshold before running the test. None of these three papers states a null. None runs a permutation test. None corrects for the many model and feature combinations it searched. The accuracies arrive clean and round, 92.40% and 98.7%, with no distribution behind them and no account of how many configurations were tried before those landed.
$$ \mathbb{E}\big[\max_{1 \le k \le K} |t_k|\big] \approx \sqrt{2 \ln K} $$
Under the null of no edge, the largest t-statistic you expect to see across K independent tries grows like the square root of twice the natural log of K. Try 20 feature-and-model combinations on noise and the best one shows an expected t near 2.45, comfortably past the naive 1.96 threshold that says "significant." This is why Harvey, Liu, and Zhu argue the hurdle for a genuine factor claim should sit near 3.0, not 2.0, once you account for the hundreds of specifications the profession quietly searched. A paper that reports one round accuracy from an unstated search has not cleared any hurdle, because it never built the null distribution to clear.
What the honest paper does instead
Put the control specimen back on the table. The MNQ falsification study fixes every hole above before it reports a result. It fills every entry at the next bar's open, so no signal touches its own entry price. It subtracts two points of round-trip friction on every trade. It demands all five gates at once: an out-of-sample t-statistic at or above 2.0, at least 30 trades, positive net return after cost, stability across every year, and a permutation p-value below 0.05. It plants two known-good signals as positive controls and confirms the harness accepts them, at t-statistics of 5.83 and 5.15. Then it reports the finding without spin: fourteen popular setups, zero survivors.
That is what a real ML trading result looks like, and the contrast is the point of this whole desk. The fakes are easy to produce and easy to publish; a language model can generate the prose, the tables, and the boilerplate figures in an afternoon, and a predatory journal will print it. The honest version is expensive, it usually returns a null, and the null is the value. When you cannot tell the two apart from the abstract, run the six tests: check what the label is a function of, compute the do-nothing accuracy from the base rate, search for a cost model, try to read a number off a figure, sample the reference list, and look for a stated null. Any single failure is enough to set the paper down.
KEY POINTS
- Three published ML trading papers report 98.7%, 92.4%, and a 15% improvement. All three fail on their own printed numbers. High accuracy is the first thing to distrust, not the last thing to celebrate.
- Check what the label is a function of. The Hafid XGBoost paper predicts a moving-average crossover from features built on the same price; a zero-information "predict last bar" baseline scores 97.5%, above the reported 92.4%. Circular labels manufacture accuracy.
- Compute the do-nothing accuracy from the base rate. At one manipulation per 638,000 transactions, a model that flags nothing scores 99.99984%, higher than the multi-modal paper's 98.7% headline. Raw accuracy on an imbalanced problem is a non-result.
- Solve for the implied false-positive rate. The multi-modal paper's 97.9% precision at that base rate requires fewer than one false alarm per 30 million clean transactions, which no noisy classifier delivers.
- Search for a cost model. None of the three subtracts friction or reports net P&L, a Sharpe, or a profit factor. Net equals gross minus cost, and a directional-accuracy number never converted to net-of-cost return is not a trading edge.
- Try to read a number off the figures. Synthetic-looking violin plots, noise heatmaps, and boilerplate captions ("hierarchical layout with color-coded components") are decoration, not evidence.
- Sample the reference list. A market-surveillance paper citing monoclonal antibodies and stroke thrombolysis, with the same author cluster recycling across bibliographies, is a citation ring. One paper even copied its own 92.4% into a competitor's comparison row.
- Look for a stated null. Under noise, the best of 20 tries shows an expected t near 2.45, which is why the real hurdle sits near 3.0. A single round accuracy from an unstated search clears nothing. The honest MNQ study states its null, subtracts costs, plants positive controls, and reports zero survivors.
References
- Evidence-Based Technical Analysis - David Aronson (Amazon)
- Systematic Trading - Robert Carver (Amazon)
- [teardown target] Multi-modal Market Manipulation Detection in High-Frequency Trading Using Graph Neural Networks (Multi-modal Market Manipulation Detection in High)
- [teardown target] Anomaly Pattern Detection in High-Frequency Trading Using Graph Neural Networks (Anomaly Pattern Detection in High-Frequency Trading)
- [teardown target] Predicting Market Trends with Enhanced Technical Indicator Integration and Classification Models (predicting market trends with indicators and classification)
- Structural Limits of OHLCV-Based Intraday Signals in MNQ Futures: A Systematic Falsification Study (ssrn-6709401)
A note on AI. The ideas, research, analysis, and conclusions in this article are my own. I use AI tools to help with editing and wordsmithing, because English is not my first language, and I am not shy about that. AI-generated ideas and AI-assisted writing are not the same thing: the first is empty slop from a generic prompt, the second is a tool for communicating years of real research more clearly. Judge the work by its substance, not by whether software helped polish the prose.