9.36 How Manipulatable Are Prediction Markets? The Field Experiment
Two economists shocked 817 prediction markets by 5 points each. Sixty days later the shove was still there. Prices revert, but slowly, partly, and cheaply beaten in thin markets.
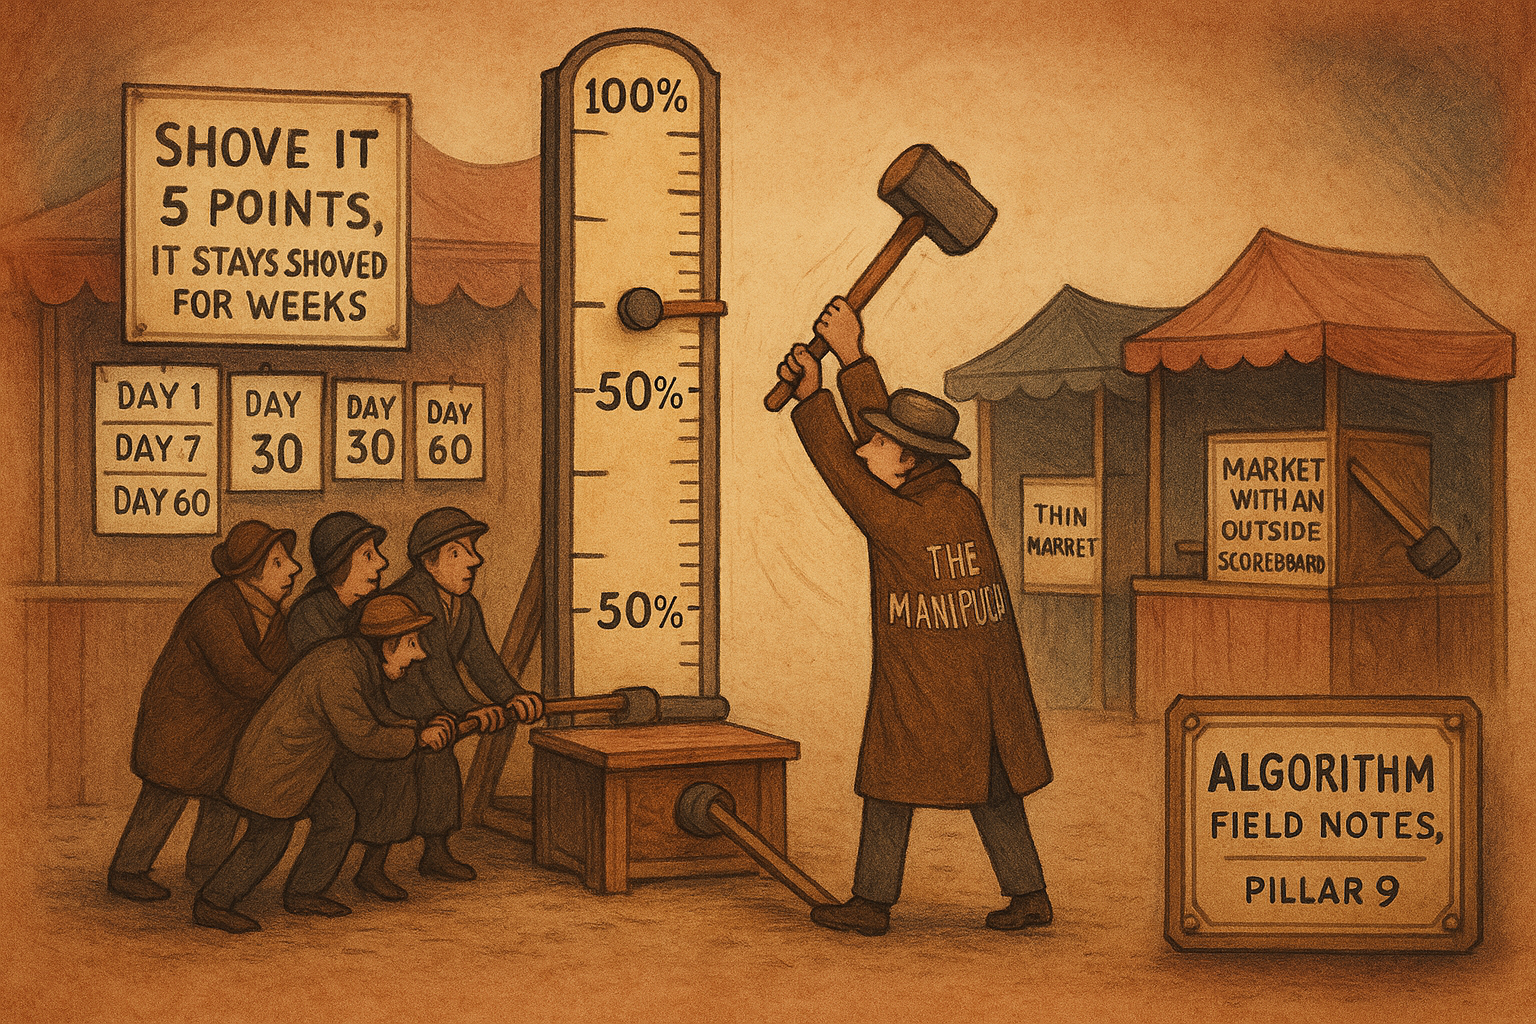
Two economists walked onto Manifold Markets and bought their way into 817 separate prediction markets, on purpose, to move the prices. In each one they either pushed the yes price up by 5 percentage points, pushed it down by 5, or left it alone as a control. Then they walked away and watched. They logged the price every hour for 30 days, took one more snapshot at 60 days, and ended up with about 600,000 price observations. The question was simple and old: does a manipulative trade get washed out fast by everyone else, or does the shove stick?
The textbook answer, going back to Wolfers and Zitzewitz, is that manipulation has no discernible effect except during a short transition, because rational traders pounce on the mispricing and undo it. Itzhak Rasooly and Roberto Rozzi ran the first large field experiment built to test that claim, and the textbook lost. The shove stuck. Sixty days later, the markets they had pushed up were still trading higher than the markets they had pushed down, and the gap was still significant at better than the 1% level. Prices did revert, but only part way, and the reversion ran out of steam after the first week. If you trade the price a prediction market shows, this is the risk the old article "The Six Ways to Lose Money on Polymarket" was pointing at: the number on the screen is movable, and it stays moved longer than the efficient-markets story admits.
The experiment, and why the design is the point
The clever part is that the randomization happens at the market level, not the trader level. Each of the 817 markets was assigned by coin flip to yes, no, or control, so the difference in average price between the yes group and the no group has a clean causal reading. No storytelling about who traded and why. You shocked a random half up and a random half down, and any surviving gap between them is your treatment effect.
The setup was disciplined in ways most trading "studies" are not, and the discipline is worth copying. They pre-registered the whole analysis plan in December 2023 before placing a single bet, so the hypotheses and the regressions were locked in advance. They set the sample size from a power calculation: 849 markets to get 90% power to detect a 3 point gap after a week, which after dropping markets that broke the inclusion rules left 817. They threw out markets with fewer than 10 traders, markets too expensive to move 5 points on their budget, brand-new markets, and any market closely related to another already in the sample, so one bet could not leak into another through arbitrage. This is a backtest done as an actual experiment, the standard the old article "The Six Ways to Lose Money on Polymarket" keeps demanding and rarely gets.
The pricing engine you are betting against
To understand why a shove might stick, you have to understand how the price is even set. Manifold runs an automated market maker on the constant product rule. The maker holds a reserve of yes shares y and no shares n. When you spend x currency to buy yes, the maker first turns your x into x yes shares and x no shares, so reserves jump to (y+x, n+x), then hands you the number of yes shares q that keeps the product of its reserves where it was.
$$ (y + x - q)(n + x) = y\,n $$
Read it as a conservation law. Before your trade the reserves multiplied to y times n, and after your trade the maker keeps that product constant by choosing how many yes shares q to give you. Work it: start with balanced reserves of y = 1000 and n = 1000, so the product is 1,000,000. Spend x = 40 to buy yes. Reserves become (1040, 1040) before the maker pays you, and it needs (1040 minus q) times 1040 to equal 1,000,000, so 1040 minus q equals 961.54, which means q equals 78.46 yes shares. Your $40 did not buy 80 shares at 50 cents. It bought 78.46, because the price climbed as you ate the reserve.
The price the market reports is the marginal price, the cost of the next tiny share, and it comes straight out of the reserve ratio.
$$ p = \frac{n}{n + y} $$
This is the implied probability the market is quoting. With reserves of (1000, 1000) it is 1000 divided by 2000, which is 0.50, a coin flip. After the $40 yes buy above, the yes reserve dropped to 961.54 and the no reserve rose to 1040, so the new marginal price is 1040 divided by (1040 plus 961.54), which is 0.5196. A $40 bet moved the quoted probability from 50.0% to about 52.0%. Push harder and it moves more, but never linearly, because the reserve fights back. This marginal price also decides who does what: a trader whose personal belief sits above the current p buys yes, a trader whose belief sits below it buys no, and a trader who agrees with p sits out. Manifold's actual rule, Maniswap, generalizes this by holding y-to-the-p times n-to-the-(1 minus p) constant so markets can start off balance, but at a 50% start it collapses back to plain constant product.
Why the shove should snap back, in theory
Rasooly and Rozzi build a model where traders are risk-averse, hold different beliefs, and understand that their own trades move the price. The load-bearing assumption is decreasing absolute risk aversion, meaning a person puts more dollars at risk as they get wealthier, which is both realistic and what makes the math tractable. From it comes the reversion logic. Suppose a manipulator buys yes and drags the marginal price up from p to p plus some jump. Traders who were comfortable holding yes now find yes too expensive relative to their belief and trim it; traders sitting in the middle flip from yes to no; traders below the old price pile further into no. Every one of those moves pushes the price back down toward where it started.
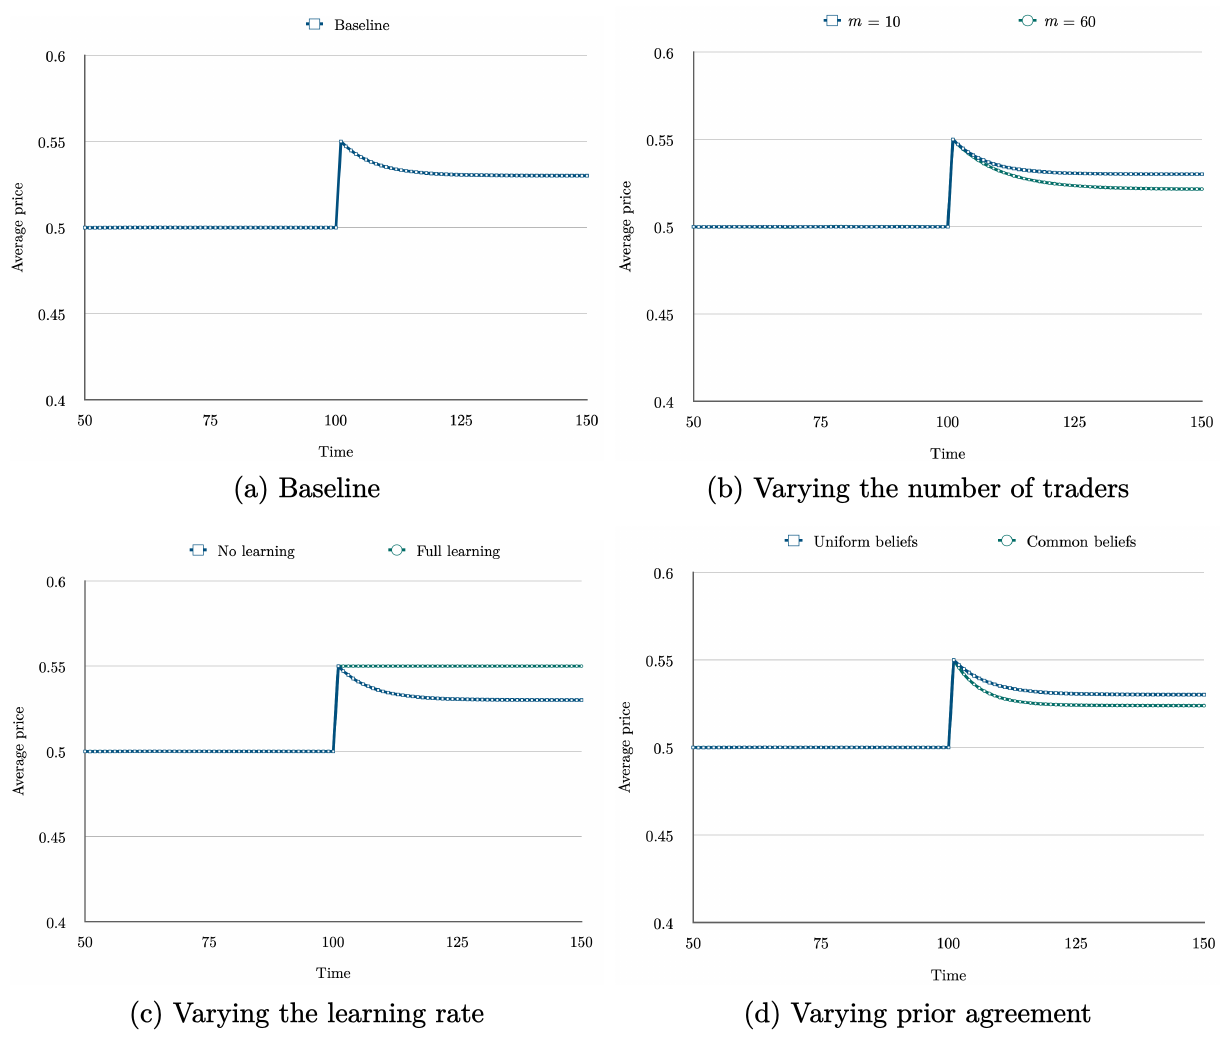
So the model says reversion is real, but it does not promise the reversion is complete, and that is the whole fight. Simulating a baseline market with 11 traders, balanced reserves, and beliefs spread evenly, a shock from 0.50 to 0.55 reverts only about 40% of the way even after prices settle. Three knobs change how much sticks. More traders means more wealth aimed at correcting the error, so faster and fuller reversion. More "learning", where traders treat the market price itself as evidence and update their own beliefs toward it, makes the shove stickier; at full learning the manipulation never reverts at all, because the fake price teaches everyone the fake is true. More prior agreement among traders makes a market hard to move in the first place, since a crowd that already agrees the answer is 0.50 will fight anything else.
What actually happened
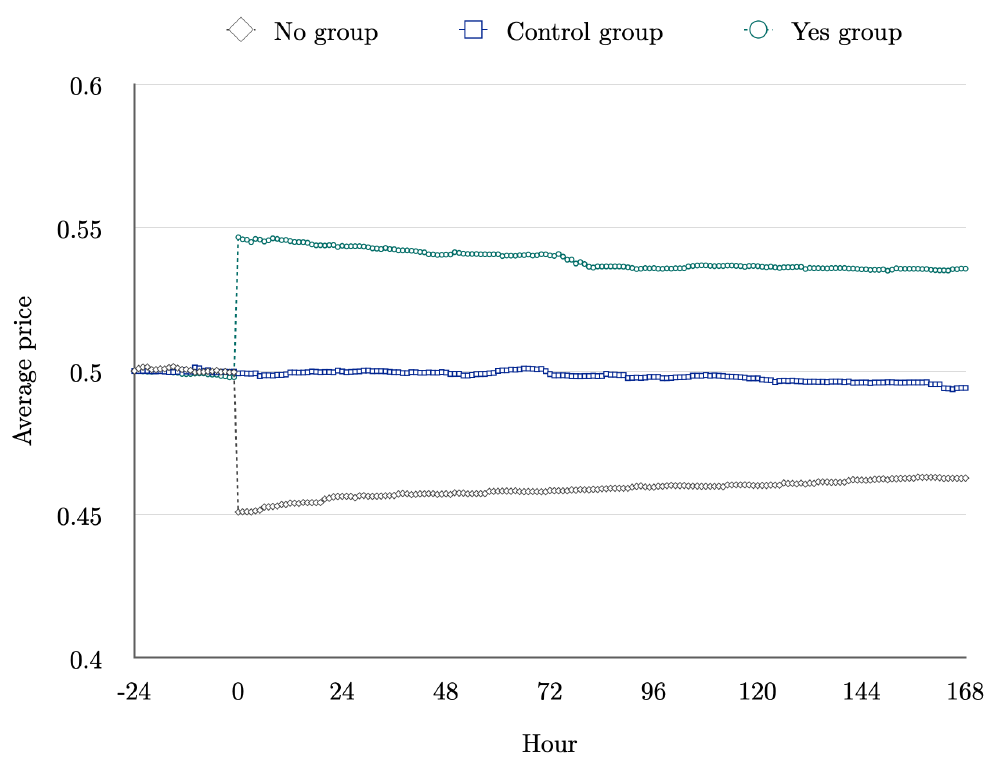
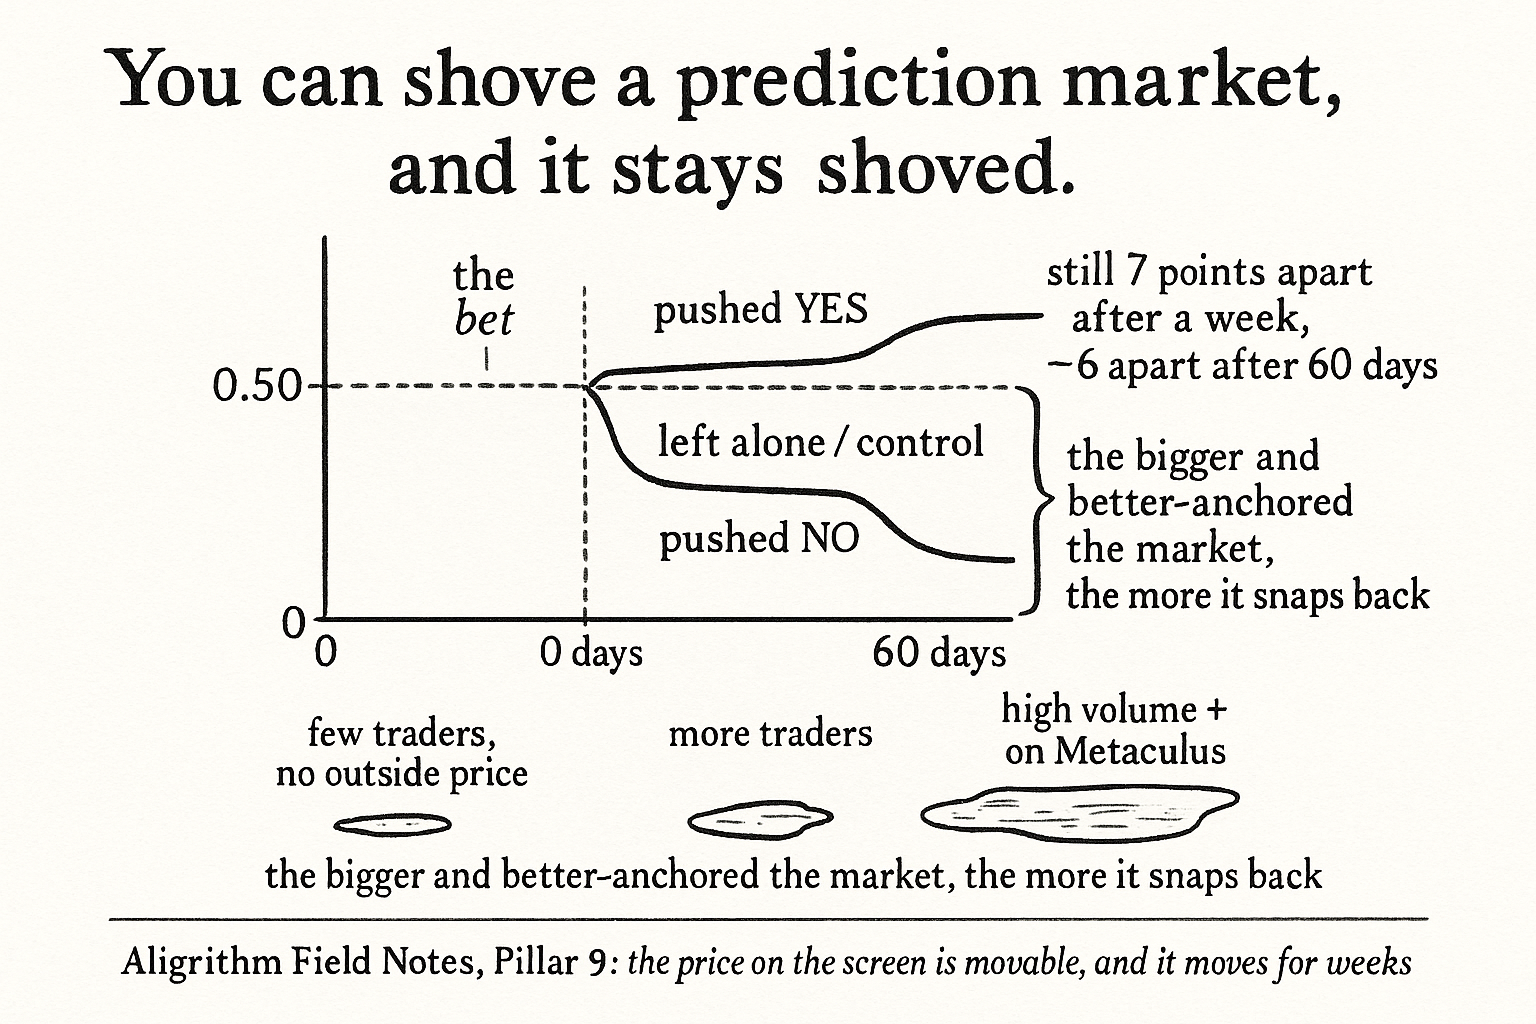
The raw picture is the cleanest evidence. Before the trade, all three groups sit together near 0.50. At hour zero the yes group jumps up 5 points and the no group drops 5, opening a 10 point gap. Then the gap narrows, but slowly, and it never closes.
They put numbers on it with a regression estimated hour by hour.
$$ p_{t,i} = \beta_0 + \beta_1 \, \mathbb{1}_{Y,i} + \beta_2 \, \mathbb{1}_{C,i} + \beta_3 \, p_{-1,i} + u_i $$
Here p at time t in market i is explained by a yes dummy, a control dummy, the pre-bet price p-minus-1 (thrown in to soak up baseline noise and buy power), and an error. The no group is the baseline, so the coefficient beta-1 is exactly the yes-minus-no price gap at time t. Trace it over time and the story is quantitative: the gap opens near 10 points, stands at about 7.3 points after one week, so only about a quarter of the shock washed out in the week everyone said would erase it. Push the horizon out and reversion keeps crawling: 25% gone after the first week, but just another 6% over the following three weeks. At 60 days the gap is still 5.9 points among markets that had not yet resolved, which is 41% reversion and 59% still standing. The standard error grew as expected, from 0.004 at a week to 0.014 at 60 days, and the effect stayed significant at p below 0.01 the whole way. A quick symmetry check, testing whether the yes push and no push were mirror images, could not be rejected (p = 0.124), so the effect is not an artifact of one direction.
Reversion is front-loaded, and some markets barely move
The averages hide a pattern the model predicted: how much of the shove survives depends on the market. Splitting the sample at the median of each characteristic and measuring one-week reversion, the thin, quiet, isolated markets are the soft targets.
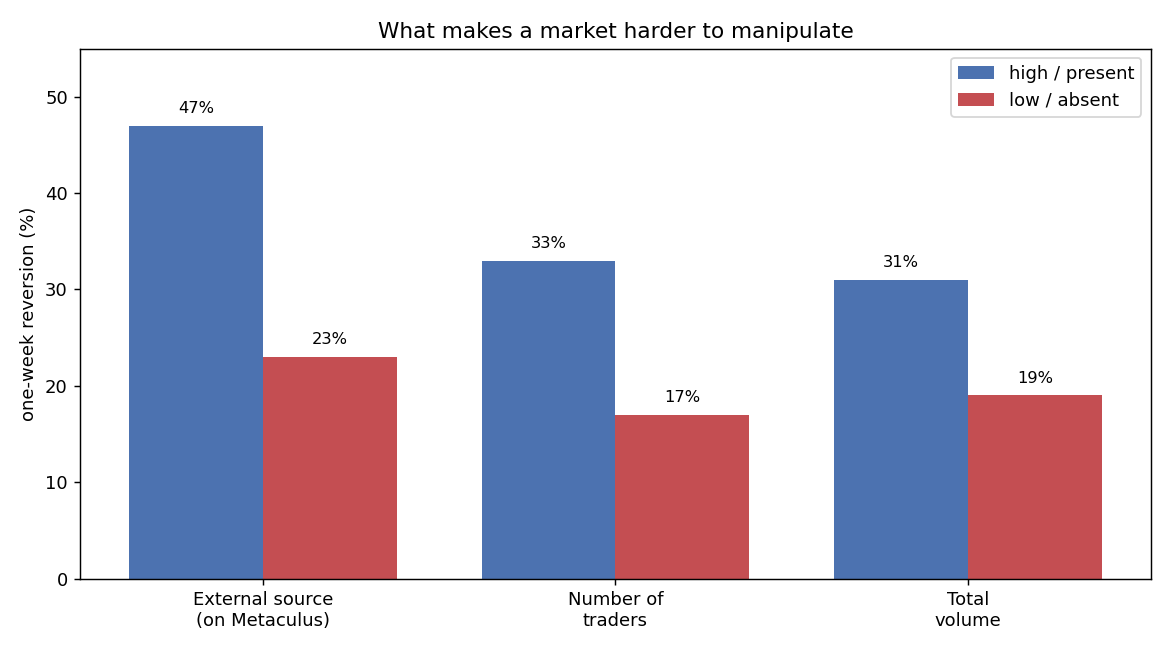
Markets whose question also lived on Metaculus reverted 47%, against 23% for markets with no outside price to anchor on, which fits the learning story: when traders have an external probability to check against, they lean less on the manipulated market price and the shove teaches them nothing. Markets with above-median traders reverted 33% against 17% for the thin ones. Above-median volume reverted 31% against 19%. Push into the top quarter by trader count, markets averaging 56 traders and 349 final trades, and reversion climbs to 37%, but even there the effect stays significant. The soft caveat: these market traits were not randomly assigned, only the yes-no-control label was, so the heterogeneity is suggestive rather than airtight causal. The direction is exactly what the model called.
Real money did not fix it
The obvious objection is that Manifold runs on Mana, a play currency you cannot cash out, only donate to charity, so maybe traders just do not fight hard enough to correct prices. Manifold then launched Sweepcash markets, redeemable near 1-to-1 with dollars, and the authors reran the experiment on 110 of them, shifting the shock to 4 points to avoid tipping off traders who had seen the working paper. Same two findings. The yes group stayed above the no group on every recorded day, and reversion showed up again and slowed over time. Matching markets by activity, Mana reverted 51% and Sweepcash 43%, close enough that swapping play money for real money did not rescue the efficient-price story. They spent $15.72 per trade on average, about $1,729 total, to move a set of real-money markets and make it stick for the days the experiment survived before Manifold pulled Sweepcash.
Where this connects
The old article "The Dutch Book Theorem, Plainly, and Why Polymarket Will Always Have Arbitrage" argued that incoherence is a permanent feature of these markets, not a bug competition erases. This experiment is the companion fact on the price itself. If a random 5 point shove can persist for two months, then the "wisdom of the crowd" number a prediction market advertises is not a clean probability you can lift and trade. It is a price that a modestly funded actor can bend and hold, most easily in the thin, unwatched markets that make up the long tail of every platform. That is a direct entry in the ledger the old article "The Six Ways to Lose Money on Polymarket" keeps: before you treat a market price as truth, ask how many traders stand behind it, whether an outside source pins it, and how much it would cost someone to move it. On Manifold, moving it 5 points and keeping it there for a week cost less than the price of dinner, and the crowd took two months to mostly not fix it.
KEY POINTS
- The study is a pre-registered field experiment: 817 Manifold markets randomly assigned to a yes shock (+5 points), a no shock (-5 points), or control, with hourly prices logged for 30 days and a snapshot at 60, about 600,000 observations.
- The manipulations persisted. The yes-minus-no price gap opened at 10 points, still sat at 7.3 after a week, and was 5.9 points (41% reverted, 59% surviving) among unresolved markets at 60 days, significant at p below 0.01 throughout.
- Reversion is real but partial and front-loaded: about 25% in week one, only another 6% over the next three weeks. The old efficient-price claim that manipulation washes out fast does not hold here.
- Prices are set by a constant-product automated market maker, keeping (y+x-q)(n+x) equal to y times n, with the quoted probability equal to n divided by (n+y). Pricing is nonlinear, so a bet moves the price less the deeper it eats the reserve.
- The model, built on decreasing absolute risk aversion, predicts reversion because a higher price makes existing yes-holders trim and pessimists pile into no. It also predicts stickier manipulation when traders learn from the price itself.
- Harder-to-manipulate markets are the ones with an external anchor (on Metaculus, 47% reversion versus 23%), more traders (33% versus 17%), and higher volume (31% versus 19%).
- Rerunning on real-money Sweepcash markets gave the same result, so play money was not the reason prices failed to correct. Moving a market 5 points and holding it for a week cost only a few dollars per trade.
A note on AI. The ideas, research, analysis, and conclusions in this article are my own. I use AI tools to help with editing and wordsmithing, because English is not my first language, and I am not shy about that. AI-generated ideas and AI-assisted writing are not the same thing: the first is empty slop from a generic prompt, the second is a tool for communicating years of real research more clearly. Judge the work by its substance, not by whether software helped polish the prose.