10.17 Getting the Target Right: The Transform That Beats 147 Features
The return you predict matters more than the 147 features you feed the model. Demeaning, standardizing, or ranking the target moves monthly alpha ~0.9pp; feature transforms move it ~0.4pp.
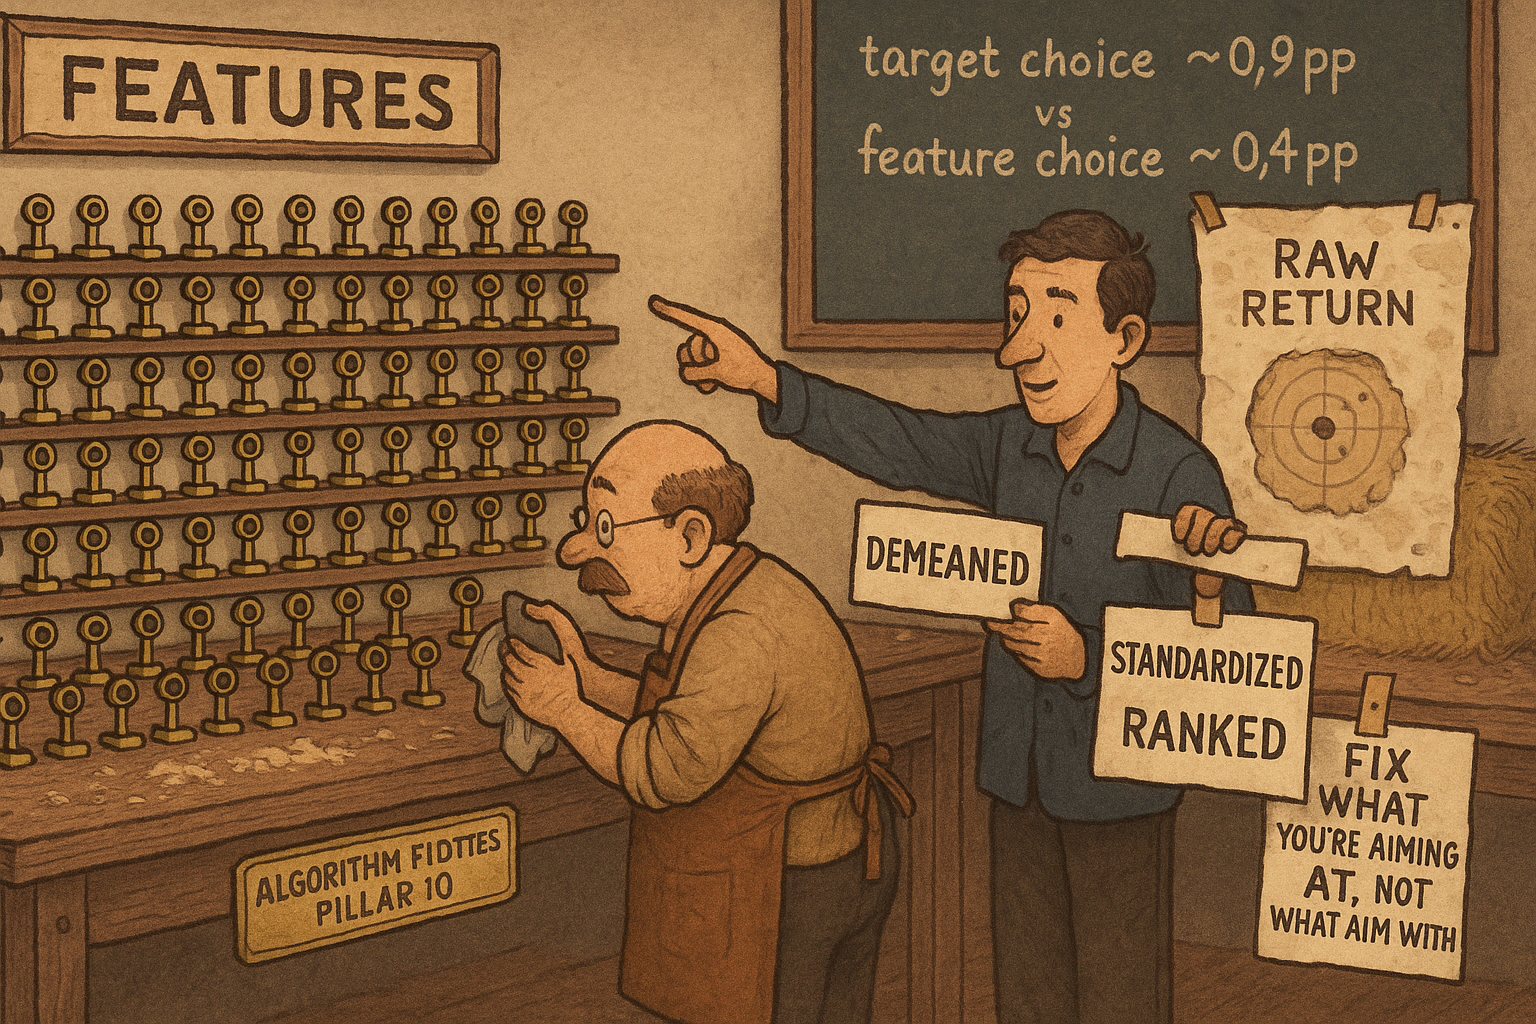
Most machine-learning asset-pricing papers spend their budget on the same three things: more characteristics, a fancier model, a longer training window. Gu, Kelly, and Xiu fed 94 signals into a neural net. Jensen, Kelly, and Pedersen assembled 153 characteristics into a global replication dataset. The arms race is on the input side. Cakici and Zaremba took that whole machine, froze the 147 characteristics and the eight-model ensemble, and changed one thing almost nobody touches: how the return you are predicting is written down. That single knob moved more alpha than any feature choice they tried.
The setup is boring on purpose. A panel of 80,148 firms across 35 developed and emerging markets, monthly, 1994 to 2024, out-of-sample from 2003. The 147 firm characteristics come straight from the Jensen-Kelly-Pedersen catalog. The forecast is an equal-weighted average of eight standard models: OLS, ridge, LASSO, elastic net, PLS, random forest, gradient boosting, and a shallow neural net. Nothing here is new. What they vary is a grid of six transformations of the target return crossed with five transformations of the input features, thirty combinations in total, run identically through the same pipeline so the only thing that can explain a performance difference is the transformation itself.
The result is a hierarchy. Get the target right and the features barely matter. Get the features right while leaving the target raw and you are optimizing the wrong margin. This is the cross-sectional cousin of the point the old article "Selection vs Diversification: Why |t|>3 Throws Away Alpha" made about significance thresholds: the decision that looks like plumbing is the one that decides your P&L.
The asymmetry nobody questioned
Look at how the field actually preprocesses data and you find a lopsided habit. Features almost always get transformed. The standard move is to rank-map each characteristic into an interval like [-1, 1] so that book-to-market and momentum sit on the same scale and no single variable dominates the fit for mechanical reasons. The target, though, usually enters raw, as the plain one-month-ahead excess return. Gu, Kelly, and Xiu do it. Most of the papers that followed do it.
Raw returns are a bad target for a cross-sectional model, and the reason is the market. In a down month almost every stock is red; in an up month almost every stock is green. A model trained on raw returns learns to associate predictors with those market-wide swings, so it ends up encoding "returns tend to be high or low in months that look like this" instead of "stock A beats stock B this month." That is a time-series lesson bolted onto a cross-sectional question. The objective and the target disagree, and the model splits the difference by learning something you did not ask for.