4.75 Does Monetary Liquidity Drive Bitcoin? Post-COVID, Increasingly
A net-liquidity gauge (Fed balance sheet minus TGA minus reverse repo) explains 65% of Bitcoin's post-COVID price level, beating fundamentals. But the sign flips pre-COVID and can't predict returns.

Ask a crypto bull why Bitcoin went to seventy thousand and you get one of two answers: halving-driven scarcity, or "the money printer." Jinsha Zhao and Jia Miao took the second claim and put a number on it. They borrowed a liquidity gauge that practitioners have muttered about for years, ran it against Bitcoin's price over 457 weeks, and found that since COVID it explains more of Bitcoin's price level than hashrate, active addresses, and trading volume combined. That sounds like the bull's dream headline. Read the regressions closely and it is something narrower and more interesting: a real level correlation, a sign that flips across regimes, and an author who quietly admits the whole thing has almost no power over the returns you would actually trade.
This is a Pillar 4 driver study, so treat it the way the old article "Why FX Traders Must Watch Gold, Rates, and Equities" treated currencies. A price with no cash flow is a relative number pushed around by forces outside itself. For a currency those forces are rates, equities, and gold. The claim here is that for Bitcoin, post-2020, the dominant outside force is the size of the dollar system itself.
What monetary liquidity actually measures
The gauge is not M2 and not the fed funds rate. It is a net-liquidity construction that practitioners like Richard Duncan and crypto commentators have used to approximate how much cash is actually sloshing through the system. Three Fed-reported series, one subtraction each.
$$ \text{ML} = \text{Fed balance sheet} - \text{Treasury General Account} - \text{Reverse Repo} $$
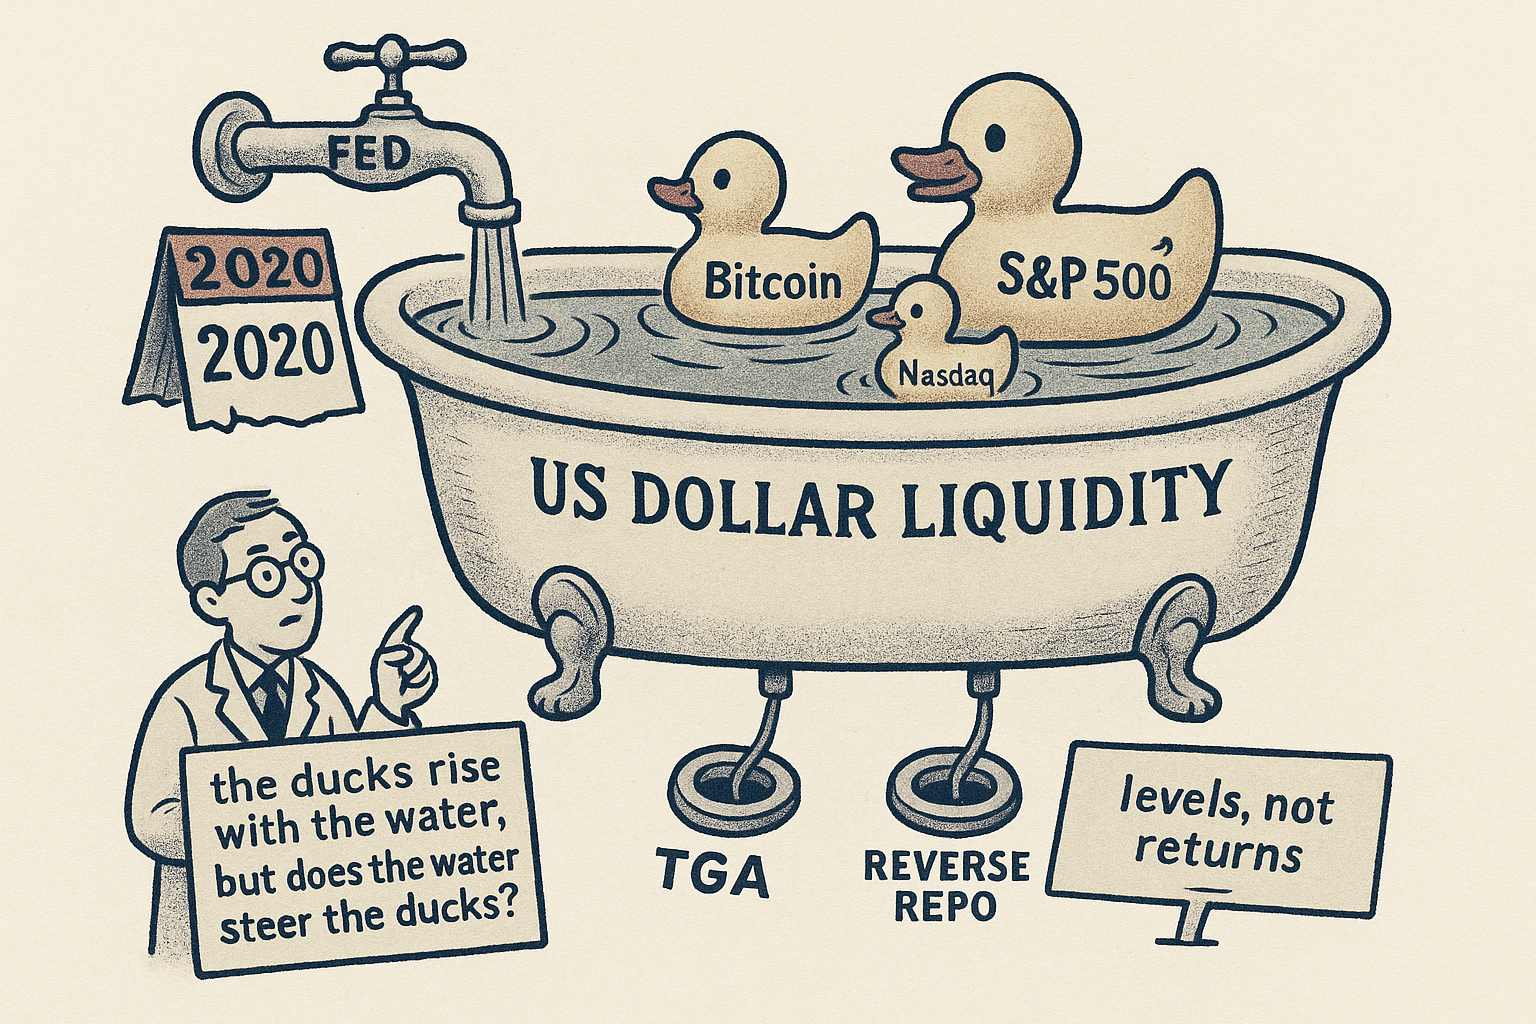
In plain language, monetary liquidity is the Fed's total assets minus two things that lock cash away from markets. The Treasury General Account is the government's checking account at the Fed; when it fills up, tax money is sitting idle instead of circulating. The overnight reverse repo facility is where money funds park cash at the Fed overnight; balances there are drained out of the banking system. So you start with everything the Fed has created, then subtract the piles that are parked and not working. Work a real one from the paper's window: near the October 2021 peak the Fed balance sheet ran about 8.5 trillion dollars, with a few hundred billion in the TGA and rising reverse repo, netting a monetary liquidity figure that topped out around 7 trillion dollars. That peak matters, because the whole Bitcoin story tracks it. Over the paper's twenty-year context ML rose more than sevenfold, and it moves weekly, which is why the authors prefer it to M0: same shape as the narrowest money measure, but with four times the data points.
The subtraction is the clever part and the reason this beats a naive "Fed balance sheet" chart. After 2022, as rates rose, cash flooded into the reverse repo facility to earn a safe return. The balance sheet barely shrank, but liquidity drained quietly out the side door. ML caught that; total assets did not.
The regression that lit up
The test is an ordinary least squares regression of the log of Bitcoin's price on the log of ML, weekly from July 2015 to April 2024, 457 observations. Log-log means the coefficient is an elasticity, a percent-for-percent sensitivity.
$$ \ln(\text{BTC}_t) = \alpha + \beta \cdot \ln(\text{ML}_t) + \text{controls} + e_t $$
In plain language, the log of Bitcoin's price equals a constant plus beta times the log of monetary liquidity, plus whatever fundamental controls you add, plus an error. Beta is the elasticity: how many percent Bitcoin moves for each one percent move in ML. Here is the number that grabs headlines. In the post-COVID sample with ML as the only variable, beta is 5.275. Read literally, a one percent rise in monetary liquidity lines up with a 5.3 percent rise in Bitcoin's price, so a ten percent expansion of net liquidity associates with roughly a 53 percent Bitcoin rally. That is enormous leverage to a macro aggregate for an asset that is supposed to be uncorrelated to anything.
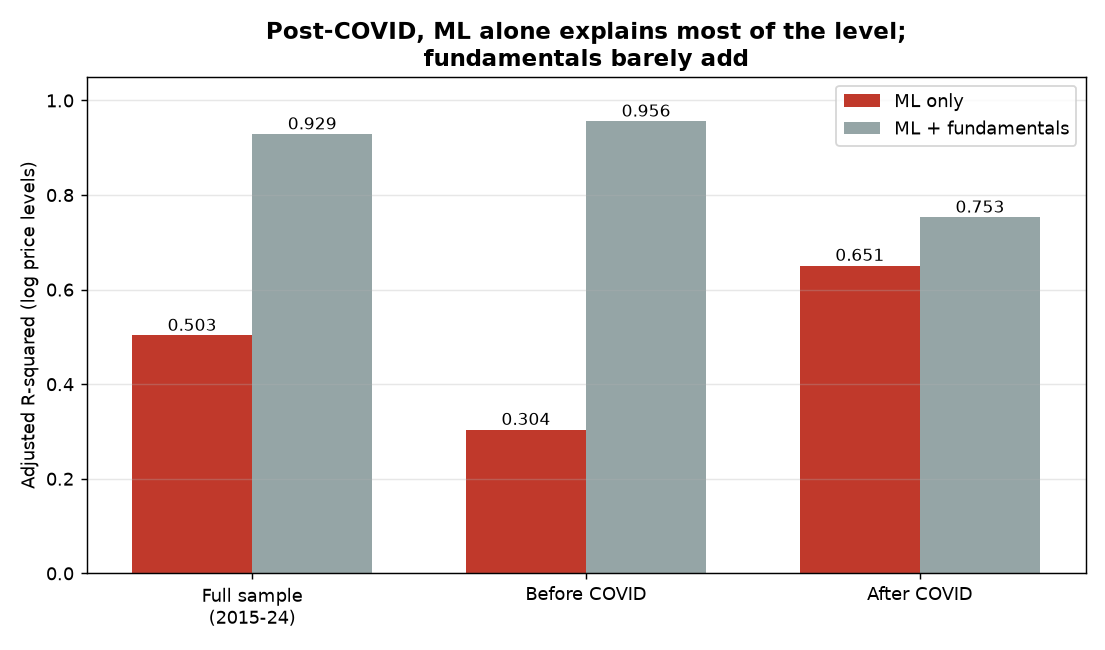
The fit backs the story up, sort of. Across the full sample, ML alone gives an adjusted R-squared of 0.503, and adding the three fundamental controls (unique addresses, network hashrate, trading volume) lifts it to 0.929. So over the whole history, fundamentals carry most of the weight and the ML coefficient collapses from 4.98 down to 1.04 once you control for them. But split at the pandemic and the picture inverts. In the post-COVID window, ML alone already explains 65.1 percent of the price level, and piling on every fundamental variable lifts the adjusted R-squared by just 10.2 points to 75.3 percent. The fundamentals stopped mattering. Liquidity took over.
Who actually drives the price: the LMG test
R-squared with correlated predictors is a liar's game, because whichever variable you enter first hogs the credit. The paper handles this properly with LMG relative importance, which is the honest way to split explained variance among predictors that overlap.
$$ \text{LMG}_k = \text{average over all orderings of the extra } R^2 \text{ from adding variable } k $$
In plain language, LMG asks how much each variable adds to the R-squared, averaged over every possible order in which you could enter the variables, so no predictor gets to free-ride on being first. A variable with an LMG of 0.30 is credited with 30 percent of the model's explanatory power. Worked from the paper: in the post-COVID period ML has an LMG of 0.584, meaning it accounts for 58.4 percent of the explained variation in Bitcoin's price level, more than the other three variables put together. Network hashrate, the workhorse of every "Bitcoin fundamentals" argument, drops to 0.111.
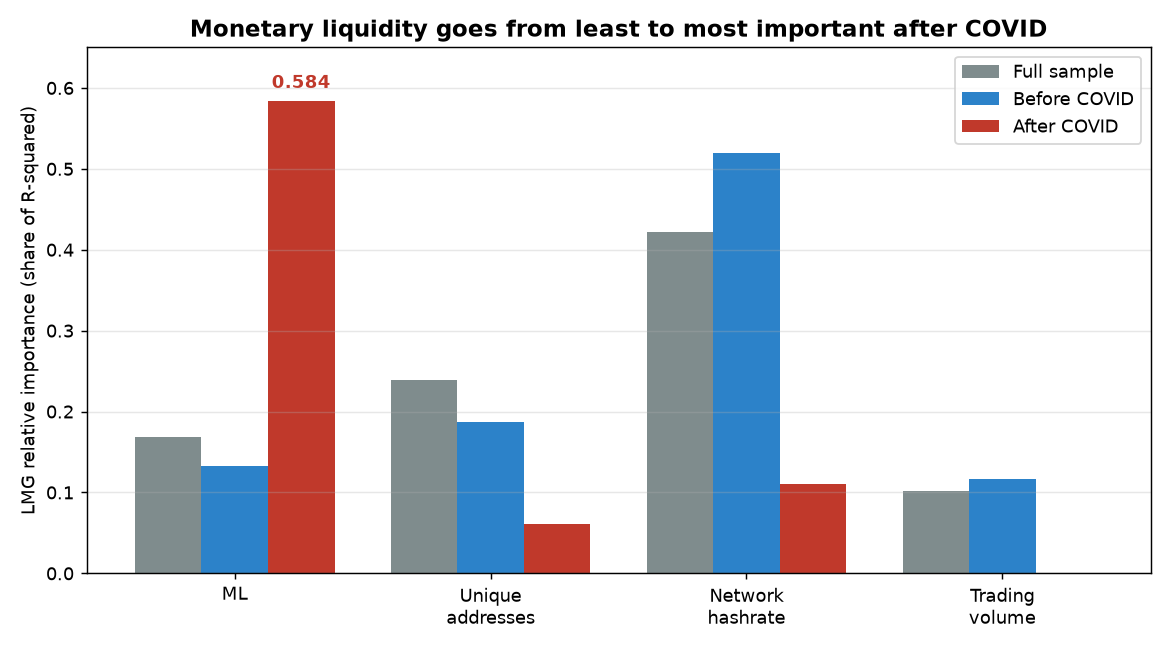
The regime shift is the whole finding. Over the full sample, network hashrate is king with an LMG of 0.422 and ML is nearly the weakest at 0.168. Before COVID, hashrate is even more dominant at 0.519 and ML sits at 0.133, essentially noise. After COVID, they trade places. This is genuinely interesting: it says the market rewriting of what Bitcoin "is" happened fast and datably, around the 2020 liquidity flood. The old article "Granger Causality: Finding What's Driving Your Currency Right Now" made the point that a driver relationship is a live, time-varying thing you have to re-measure, not a constant you calibrate once. Bitcoin's driver set flipped inside a single year.
The sign flip is the tell
Now the part the headline buries. Before COVID, the relationship was not weak, it was negative. With ML as the only regressor in the pre-pandemic sample, the coefficient is minus 11.98, strongly significant. The raw correlation between Bitcoin and ML before 2020 was minus 0.429. More liquidity went with lower Bitcoin prices.
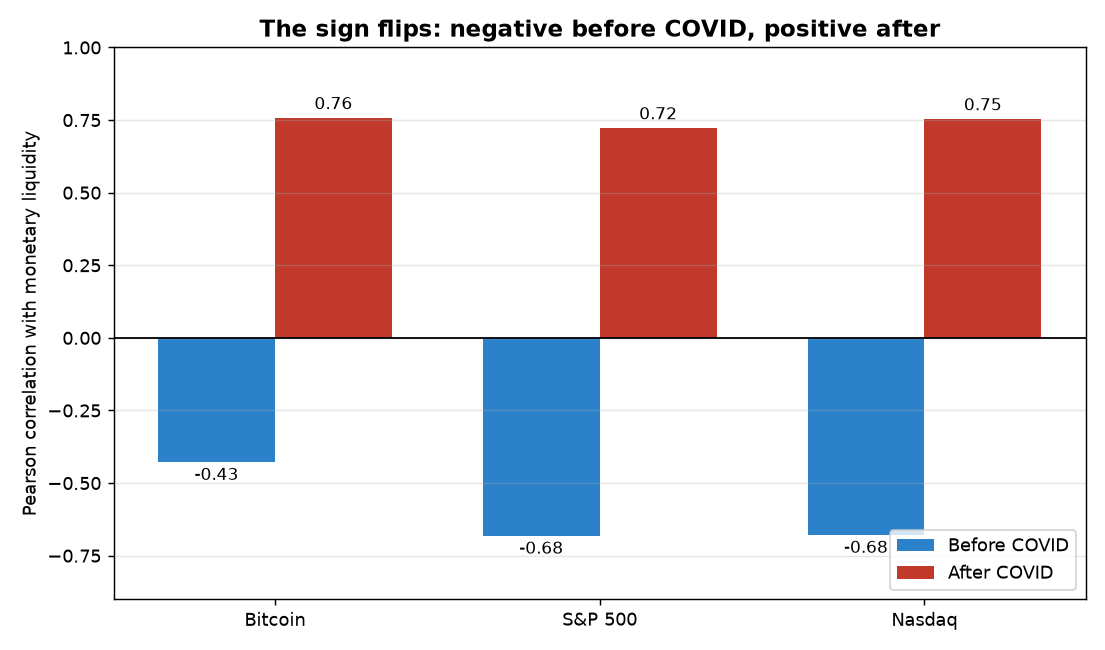
A coefficient that swings from minus 12 to plus 5 depending on which years you feed it is not the fingerprint of a structural law. It is the fingerprint of two trending series whose alignment depends on the regime. Before 2020, Bitcoin was climbing on adoption while net liquidity drifted sideways to down, so the correlation came out negative. After 2020, both went vertical together, so it came out strongly positive. The paper is honest enough to report the flip in full, and a careful reader should weight it heavily: a relationship this regime-dependent is fragile, and there is no guarantee the post-COVID sign is the permanent one rather than just the current one.
Levels, not returns: why this is not a trade
Here is the sentence that should stop any trader from wiring this into a strategy, and it comes from the authors themselves: ML has "little predicted power over Bitcoin's daily (and weekly) returns." Everything above is a regression on price levels, log price on log liquidity. Both series trend up over the post-COVID sample, and two things that both trend up will show a monstrous R-squared and a towering t-statistic whether or not one causes the other. That is the textbook spurious-regression trap, and a 5.3 elasticity with a t-statistic above 20 on trending weekly levels is exactly what it produces.
The tradeable question is never "do the levels correlate" but "do changes in ML predict the next change in Bitcoin," and on that question the paper's own answer is no. Every wiggle in liquidity does not map to a wiggle in price; the short-term returns stay unpredictable. So the correct read is deflationary: monetary liquidity is a slow, low-frequency backdrop that helps explain why Bitcoin is roughly where it is over years, not a signal that tells you what it does next week. If you tried to trade the level relationship you would be long a position that only "works" over multi-year trends and gives you no edge on any horizon you can actually risk-manage. The variance-ratio and autocorrelation machinery matters here too: weekly liquidity levels are massively autocorrelated, so the 457 observations carry far less independent information than the number suggests, and the significance stars are inflated accordingly.
The causality argument is thin
The paper's title asks whether ML drives Bitcoin, and its strongest causal claim is a paragraph of reasoning, not a test. The argument goes: ML is not a traded instrument, the Fed sets it, and the Fed does not set it in response to Bitcoin, so the arrow must point from ML to Bitcoin. That rules out reverse causality but not the real threat, which is a common driver. The same low-rate, high-liquidity regime that inflates ML also inflates risk appetite, speculative leverage, and the tech complex, and any of those could be pushing Bitcoin while ML just happens to move alongside.
The paper actually strengthens the skeptic's case without meaning to. It shows the S&P 500 and the Nasdaq track ML just as tightly as Bitcoin does, with post-COVID correlations of 0.72 and 0.75 against Bitcoin's 0.76, and the identical pre-COVID sign flip to negative. The authors read this as proof that Bitcoin has become a mainstream macro asset, which is fair and is the genuinely useful takeaway: post-2020, Bitcoin trades like a high-beta Nasdaq cousin, not like digital gold, and its correlation to the dollar system is now a risk you have to model rather than diversify away. But "Bitcoin, the S&P, and the Nasdaq all move with liquidity" is also exactly what you would see if liquidity and broad risk appetite are the same underlying thing wearing different clothes. The honest verdict the paper lands on, and the one to keep, is the one it states plainly: statistical association is not causation. What you can bank is the correlation and the regime change. What you cannot bank is the printer as a lever you can pull to forecast next week's candle.
KEY POINTS
- Monetary liquidity is defined as the Fed balance sheet minus the Treasury General Account minus the reverse repo facility: total money created, minus the piles parked and not circulating. It peaked near 7 trillion dollars in October 2021 and moves weekly.
- On weekly data from 2015 to 2024, ML alone explains 50.3 percent of Bitcoin's log price level over the full sample and 65.1 percent after COVID. Post-COVID, adding hashrate, addresses, and volume lifts the fit only 10 points, to 75.3 percent.
- By LMG relative importance, ML flips from nearly the weakest driver before COVID (0.133) to the strongest after (0.584), overtaking network hashrate, which collapses from 0.519 to 0.111. The driver set rewired around the 2020 liquidity flood.
- The relationship's sign flips across regimes. Before COVID the Bitcoin-to-ML correlation was minus 0.429 and the coefficient was minus 12; after COVID they are strongly positive. A sign that flips is the mark of two trending series, not a structural law.
- This is a levels regression, and the authors admit ML has little power over daily or weekly returns. A 5.3 elasticity with a t-statistic above 20 on trending, autocorrelated weekly levels is the classic spurious-regression signature. It explains where Bitcoin sits over years, not what it does next.
- The causality claim is an argument, not a test. Ruling out reverse causality does not rule out a common driver: liquidity, risk appetite, and speculative leverage all surged together post-2020.
- The durable, tradeable takeaway is the regime change itself. Since 2020 Bitcoin correlates with ML almost exactly as the S&P and Nasdaq do, so it now behaves like a high-beta macro asset whose dollar-liquidity exposure must be modeled, not diversified away.
References
- Trading Systems and Methods - Perry Kaufman (Amazon)
- Cybernetic Trading Strategies - Murray Ruggiero (Amazon)
- The Art of Currency Trading - Brent Donnelly (Amazon)
- What Drives Crypto Asset Prices? (ssrn-4910537)
A note on AI. The ideas, research, analysis, and conclusions in this article are my own. I use AI tools to help with editing and wordsmithing, because English is not my first language, and I am not shy about that. AI-generated ideas and AI-assisted writing are not the same thing: the first is empty slop from a generic prompt, the second is a tool for communicating years of real research more clearly. Judge the work by its substance, not by whether software helped polish the prose.