6.50 Crypto TSMOM Lives in Volume-Weighted Returns
Crypto time series momentum only pays when the market return is weighted by trading volume, not manipulable market cap: 0.94%/day, Sharpe 2.17. Equal-weight the same signal and it loses 1.19%/day.

A crypto momentum strategy that earns 0.94% a day at an annualized Sharpe of 2.17 should set off every alarm you own. Huang, Sangiorgi, and Urquhart report exactly that, buying coins that went up and shorting coins that went down, rebalanced daily across 3,192 cryptocurrencies from 2014 to 2023. Before you wire money, look at one number they also report: run the identical momentum signal with equal weights instead of volume weights and it loses 1.19% a day. The signal does not carry the strategy. The weighting scheme does. That single contrast is the whole paper, and it is both the interesting finding and the reason to be careful.
Time series momentum, in the old article "Building a Trend Follower, Component by Component," is the plainest edge in trading: assets that went up tend to keep going up, so you go long positive past returns and short negative ones. Moskowitz, Ooi, and Pedersen documented it across stocks, bonds, currencies, and commodities. In crypto the record was a mess, with some papers finding strong momentum and others finding none. This paper argues the disagreement comes from a preprocessing choice nobody scrutinized: how you weight the coins when you build the market return.
Volume, not market cap, because market cap is a lie
The standard crypto "market return" weights each coin by market capitalization, following Liu and Tsyvinski. The authors refuse to, and the reason is specific. A coin's market cap is supply times price, and supply is whatever the founders say it is. Mint more coins, burn coins to manufacture scarcity, and the cap moves without a single trade happening. They point to coins like Peercoin and Namecoin carrying market caps above 1 million dollars while trading under 10,000 dollars a day. Cap says "large," the tape says "nobody is here." Volume is harder to fake with a keystroke, so they weight by trading volume instead.
$$ R_{VW,t} = \sum_{i=1}^{N} \frac{v_{i,t}}{\sum_{j=1}^{N} v_{j,t}} \, r_{i,t} $$
Read it as a weighted average: each coin i gets a weight equal to its dollar volume v that day divided by the total volume of every coin, then you sum those weighted returns. Worked example with three coins on a given day. Bitcoin trades 40 billion and returns +2%, Ethereum trades 15 billion and returns +1%, some alt trades 1 billion and returns +30%. Total volume is 56 billion. The volume-weighted return is (40/56)(2%) plus (15/56)(1%) plus (1/56)(30%), which is 1.43% plus 0.27% plus 0.54%, so about 2.24%. The alt's 30% pop barely registers because almost nobody traded it. Under equal weighting that same alt would contribute a full 10%, letting a coin nobody touched swing the index.
The choice matters before any strategy runs. The volume-weighted market averages 0.62% a day over the sample, against 0.21% for cap-weighted, 0.33% for equal-weighted, and 0.11% for Bitcoin alone. The index you pick already decides most of your answer.
The momentum is real, at least inside the index
They test time series momentum first by regressing the next day's volume-weighted market return on its own past cumulative return over horizons from one day to two weeks.
$$ R_{VW,t} = \alpha + b \, R_{VW,\,t-1:t-h} + e_t $$
The slope b answers whether the past h-day return predicts tomorrow. Positive and significant means momentum; the intercept alpha is the part unrelated to the past, and e is noise. The slope lands between 0.024 and 0.042 and is significant at the 1% level from the 3-day horizon out to two weeks, across the full sample and both subperiods. Worked reading: a b of 0.04 means that for every 1% of cumulative return over the past week, tomorrow's expected return rises by 0.04%. Small per unit, but past weekly moves are often tens of percent in crypto, so it adds up. The one-day and two-day horizons are insignificant, which fits the story that a single day is mostly noise.
Sorting sharpens it. Group each day by the tercile of past return and look at the next day. The bottom tercile earns almost nothing the next day, the middle earns more, and the top tercile earns the most, a clean monotonic ladder that holds even when the tercile cutoffs are fixed using only 2014 to 2015 data and applied out of sample through 2023.
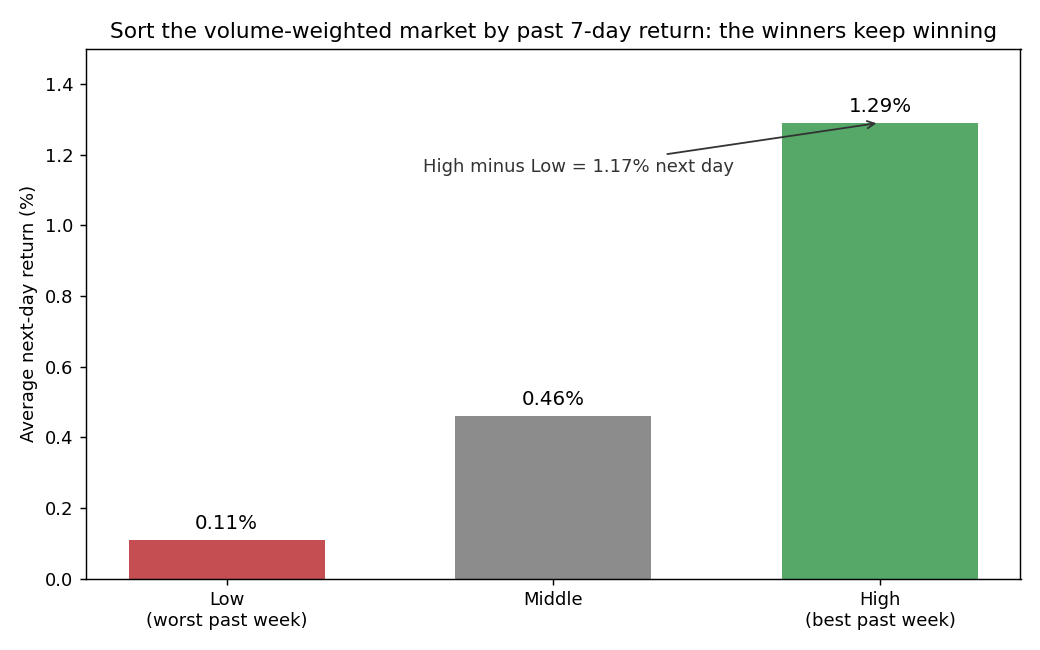
The High-minus-Low gap runs above 1% a day and the weekly version peaks near 2.9% in-sample and above 4% out-of-sample. Continuation is there.