3.37 Collinearity in Parameter Sweeps: Plateaus, Not Peaks
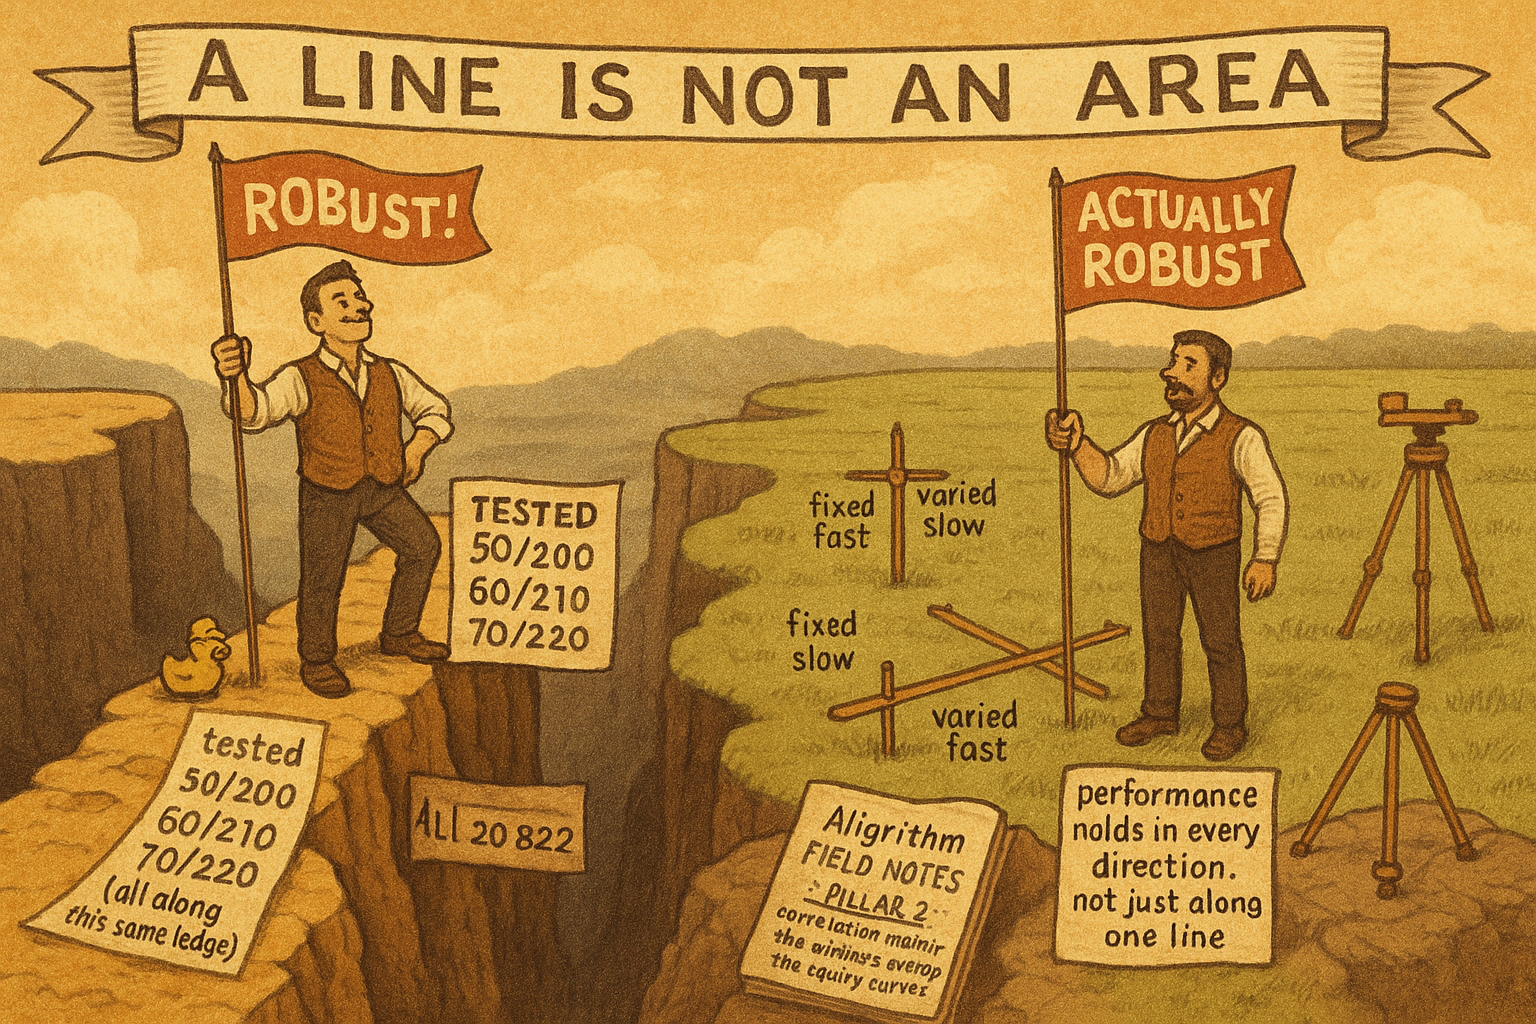
Sweeping 50/200, 60/210, 70/220 holds the ratio fixed: you test one concept along a line, not the space. That flat sweep is a thin ridge, not a plateau. Fix one parameter, vary the other, then reverse.
You vary your parameters, watch performance hold up across the range, and conclude the system is robust. The old article "Parameter Stability Beats Best Parameter" told you to prefer the stable region over the lucky peak, and you did. The trap is that you can run a parameter sweep that holds up beautifully and proves nothing, because the sweep never tested the parameter space at all. It tested one concept along a single line through that space, and the flatness you saw was collinearity wearing a robustness costume.
What collinearity does to a sweep
Collinearity means two or more of your parameters move together, linearly correlated, so changing one drags the other. Take the canonical moving-average crossover with a fast length of 50 and a slow length of 200. You decide to test sensitivity, so you sweep 50/200, then 60/210, then 70/220, and the performance barely budges across all three. Robust, you think.
$$ (50,\,200),\;(60,\,210),\;(70,\,220),\;\dots \;\Rightarrow\; \text{slow} - \text{fast} = 150 \text{ (held fixed)} $$ $$ \text{the tested points lie on a straight line in } (\text{fast},\,\text{slow}) \text{ space, correlation} \approx 1 $$
Read that as: every point you tested sits on a single line through the two-parameter plane, because you moved fast and slow in lockstep and kept their gap pinned at 150. The fast-to-slow relationship stayed put, so the crossover fires at the same relative speed in all three tests, and a strategy whose behavior is governed by that relationship behaves the same in all three. You did not probe the space around your parameters. You slid your one parameter set up and down a diagonal and confirmed that the diagonal is flat, which says nothing about what happens when you step off it.
The flat sweep is a thin ridge, not a plateau
The old article "The Hill, the Spike, and the Cliff: Reading Optimization Surfaces" named this shape directly: the thin ridge, collinearity in disguise. On a two-parameter heatmap, real robustness shows up as an area, a wide plateau with gentle gradients where performance survives moves in any direction. Collinear robustness shows up as a bright line, high along the diagonal you swept and collapsing the moment you move perpendicular to it. Both look like a stretch of strong performance if you only sampled along the line. Only one of them survives a parameter that drifts off the line in live trading, and parameters always drift off the line, because the market does not keep your fast-to-slow gap pinned at 150 for you.
So the heatmap is the right tool, as that article argued, but only if you read the topography honestly. Wide plateau and gentle slope mean the strategy tolerates being wrong about the parameters. Sharp cliff means a regime boundary is one step away. Thin ridge means you have been admiring a one-dimensional slice and calling it an area. The flat sweep along the diagonal is consistent with all three shapes, which is exactly why the flat sweep alone cannot certify anything.
Break the collinearity on purpose
The fix is to stop moving the parameters together. Fix one, vary the other on its own, then reverse and do it again.
$$ \text{fix fast} = 50,\;\text{vary slow} \in \{100,\,200,\,300\} $$ $$ \text{then fix slow} = 200,\;\text{vary fast} \in \{20,\,50,\,80\} $$
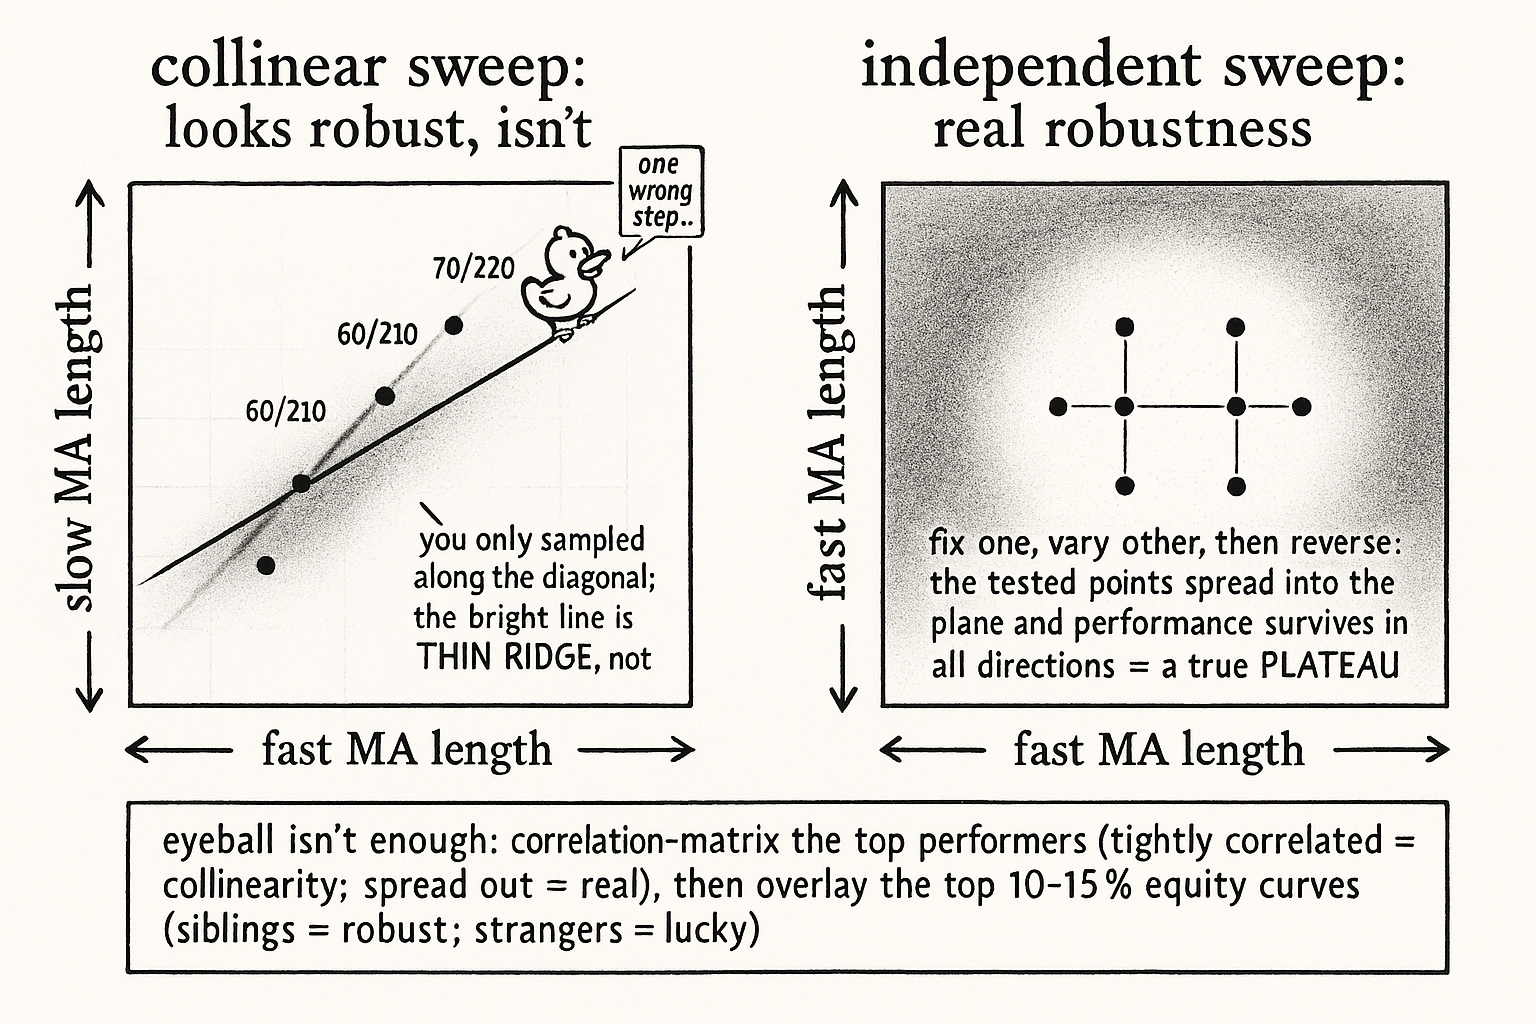
Read that as: first hold the fast length still and push the slow length across a wide range on its own, which changes the fast-to-slow relationship instead of preserving it, then swap and hold the slow length still while you move the fast one. Now your tested points spread out into the plane rather than tracing a line, so you are sampling the actual neighborhood around your parameters. If performance holds up across this cross-shaped probe, you have evidence of a genuine area of stability. If it falls apart the instant the relationship between fast and slow changes, you just caught a strategy that was robust only along a line it has no way of staying on.
Two checks past the eyeball
Reading a surface by eye gets you most of the way, and two numerical checks catch what the eye misses.
Run a correlation matrix on your top-performing parameter sets. If the winners are tightly correlated with each other, sitting along one diagonal, the apparent robustness is collinearity: the system found one configuration and you re-listed it under several labels. If the winners are spread across the parameter space and still perform, that spread is the real thing, robustness that does not depend on any one relationship holding. This is the same logic as the old article "The Backtest Integrity Checklist," whose perturbation item asks for stability under independent moves in each parameter, not stability along a convenient diagonal.
Then take the top 10 to 15 percent of performers and plot their equity curves on top of each other. Outcome metrics like final Sharpe can agree while the paths underneath them disagree violently, one curve grinding steadily and another lurching to the same endpoint through a 40 percent drawdown. Overlaying the curves shows you consistency in path and volatility, not just in the summary number, and a cluster of genuinely robust parameters produces curves that look like siblings rather than strangers who happened to finish in the same place.
The discipline
Topography testing is the right instinct and a flat sweep is the right thing to want. The failure is reading a line as an area. Vary parameters independently before you trust a plateau, correlation-matrix the winners before you believe they are diverse, and overlay the equity curves before you believe the stability is in the path and not only in the final tally. Look for flatlands, the wide region that tolerates being wrong, not peaks and not the thin bright ridge that looks like a flatland from one angle and disappears from every other.
Visualizing the ridge versus the plateau
KEY POINTS
- A parameter sweep can hold up beautifully and prove nothing if the parameters move together. Collinearity means two or more parameters are linearly correlated, so a sweep that varies them in lockstep tests one concept along a line, not the parameter space.
- The classic case: sweeping 50/200, 60/210, 70/220 holds the fast-to-slow gap fixed, so every tested point sits on one diagonal and the crossover fires at the same relative speed throughout. The flatness you see is the diagonal being flat, not the neighborhood.
- A flat collinear sweep is a thin ridge, the shape the old article "The Hill, the Spike, and the Cliff: Reading Optimization Surfaces" flagged as collinearity in disguise. Real robustness is a wide plateau that survives moves in any direction; a ridge collapses the moment a parameter drifts off the line, and parameters always drift.
- Break the collinearity: fix one parameter and vary the other independently across a wide range, then reverse. This spreads the tested points into the plane and probes the actual neighborhood instead of a diagonal.
- Run a correlation matrix on the top performers. Tightly correlated winners strung along one diagonal are collinearity; winners spread across the space that still perform are genuine robustness.
- Overlay the equity curves of the top 10 to 15 percent of performers. Summary metrics can agree while the paths disagree; a cluster of robust parameters produces curves that look like siblings, not strangers who finished in the same place.
- Read topography logically. Look for flatlands that tolerate being wrong, not peaks and not the thin bright ridge that passes for a plateau from one angle and vanishes from every other.
References
- Testing and Tuning Market Trading Systems - Timothy Masters (Amazon)
- Data Mining Algorithms in C++ - Timothy Masters (Amazon)
- The Probability of Backtest Overfitting (Bailey, Borwein, Lopez de Prado, Zhu)
- Pseudo-Mathematics and Financial Charlatanism
- A Novel Approach to Trading Strategy Parameter Optimization Using Walk-Forward Optimization
- Multicollinearity in Regression Analyses Conducted in Epidemiologic Studies