5.55 Bar Portion Beats MACD: A Directional Skew for Crypto Market Making
Crypto market making: bar portion is close minus open, divided by high minus low. A full up-bar mean-reverts, so shift the reference price down.
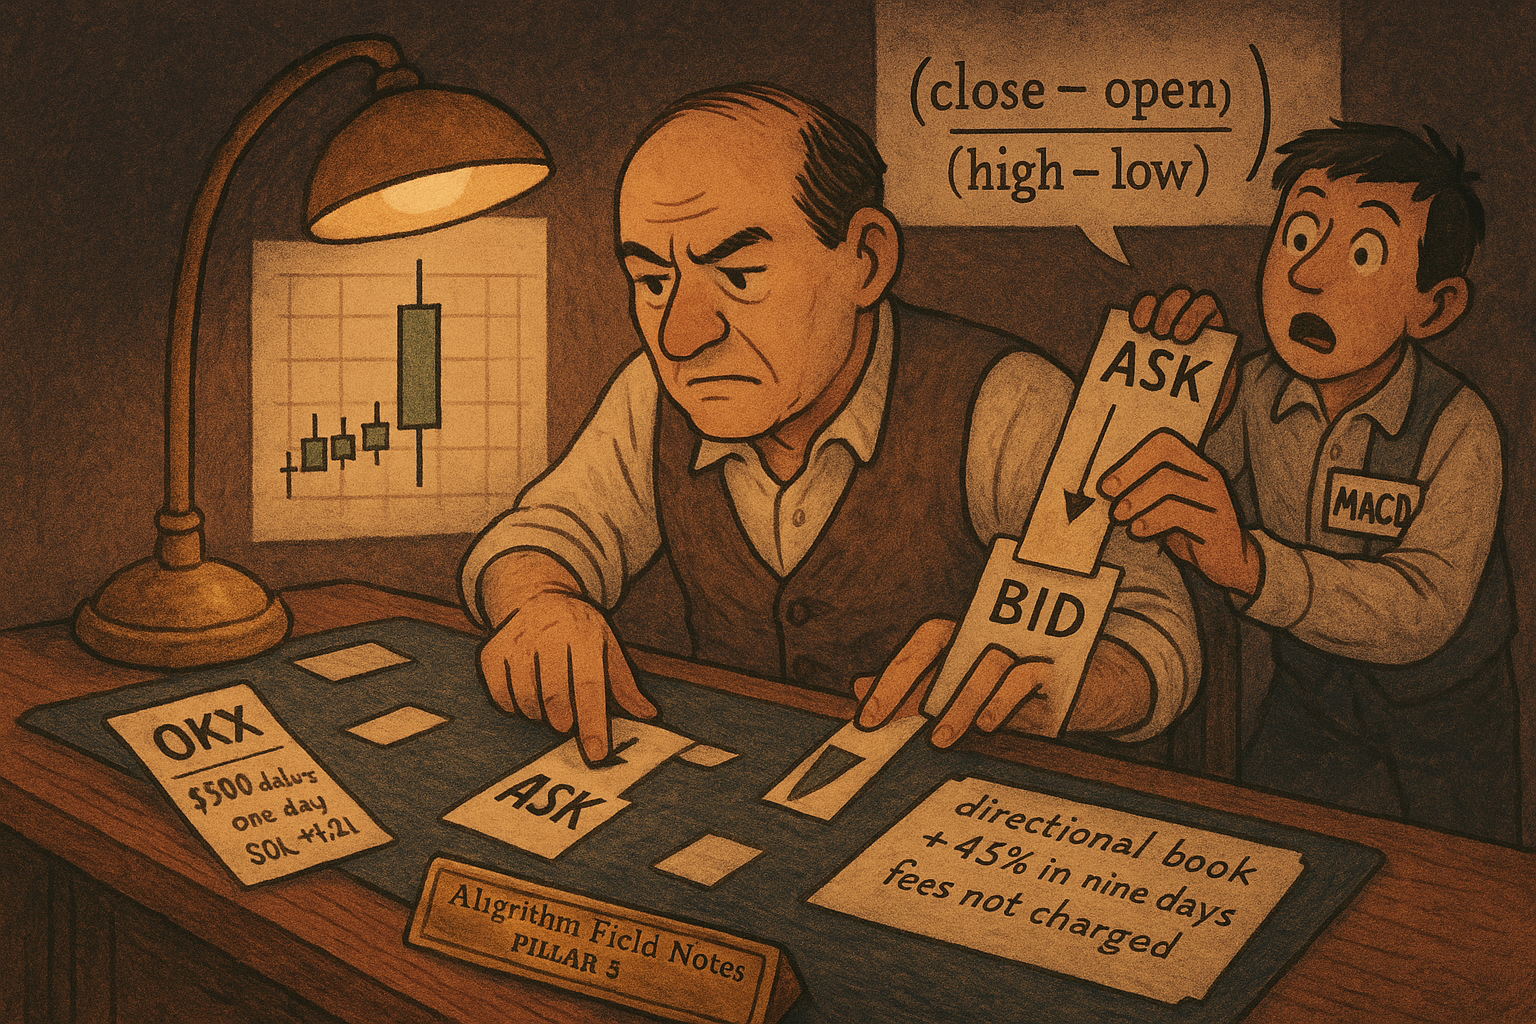
Hummingbot's dynamic pure market maker quotes a crypto perpetual around a reference price, the center between the bid and the ask, and it shifts that center with MACD, the difference between a fast and a slow exponential moving average. Stoikov, Zhuang, Chen, Zhang, Wang, Li, and Shan replace the MACD input with bar portion, close minus open divided by high minus low, on one-minute candles. In their universe of 30 perpetual coins, next-bar average returns fall monotonically as bar portion rises for a proportion 0.73 of names. A bar that closes on its high is a reason to mark the reference price down: that mark is the skew on fair price from the old article "The Three Pillars of Market Making: Fair Price, Spread, Skew". They compute it from candles because a full order-book history was outside the budget of the project.
Bar portion is the body divided by the range
The signal is the candle's body as a fraction of its full range. It lives on one-minute Binance perpetual bars, 30 names, collected from 1 Sep 2024 through 14 Oct 2024, about 60,000 rows a name.
$$ \text{Bar portion}_t = \frac{\text{Close}_t - \text{Open}_t}{\text{High}_t - \text{Low}_t} $$
The numerator is how far the bar traveled from its open to its close, with the sign of that trip. The denominator is the high-low range, so a long wick shrinks the reading even when the close moved. The ratio sits between −1 and 1 when the range is positive. A reading of −1 means the bar opened on its high and closed on its low. A reading of 1 means it opened on its low and closed on its high. A reading near 0 means the close came back to the open, whatever the wicks did.
Their own first BTC-USDT row is the worked case. Open 58941.9, high 58941.9, low 58933.4, close 58933.8. The body is 58933.8 − 58941.9 = −8.1. The range is 58941.9 − 58933.4 = 8.5. Bar portion is −8.1 / 8.5 = −0.9529. The bar opened at the high and closed almost at the low: nearly the whole range is body, and the body points down.
When the high equals the low the ratio is undefined. A flat bar has no range to divide by. They never print a rule for it. Set that bar to 0, which matches a close sitting on the open, and do it before the signal hits a quoter.
A high reading marks the reference price down
Next-bar average returns step down as bar portion rises, on a proportion 0.73 of the 30 coins. The increasing proportion is 0.00. Quintiles are five equal-count bins from the lowest fifth of the signal to the highest, with the average next-bar return inside each bin. Curvature of an exponential moving average ties bar portion at 0.73 on the same screen. They keep bar portion because the ratio has a plain reading, then report it as the best of the pool in a later directional test. That later test prints only the MACD comparison. Curvature's Sharpe on that test is unprinted.
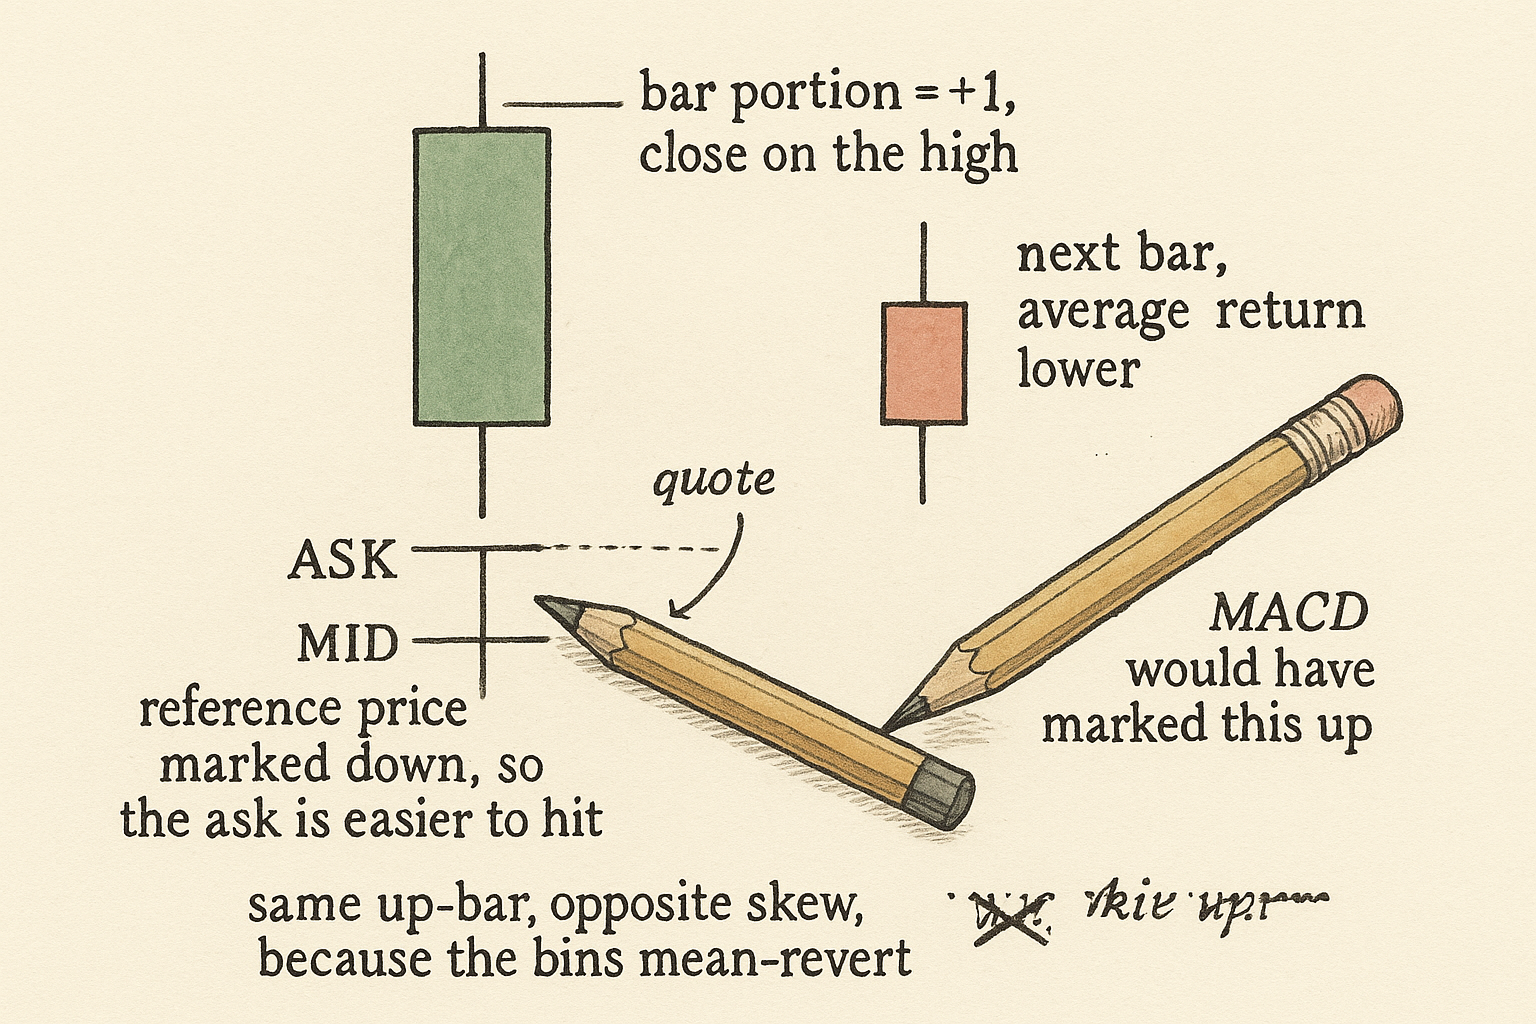
The pattern they read off the bins is mean reversion at the one-minute scale. A large positive bar portion is followed by a lower average return on the next bar. A large negative reading is followed by a higher one. The middle bins, which they place around 40% to 60% of the signal, sit near a flat next bar. The first printed BTC minute, at −0.9529, is the low end of that ladder, so the average next bar after a reading like it is the high end of the ladder.
They turn the ladder into a position with a rolling one-factor regression. The source describes the regression and does not print the expression.
$$ \hat{r}_{t+1} = a + b \cdot \text{Bar portion}_t $$
The fit uses the trailing 36 days, 51,840 one-minute rows, which is 36 × 1,440 exactly. It then forecasts the next 9 days. A positive forecast puts that coin 100% long. A negative forecast puts it 100% short. They do not print a or b. The quintiles are what a negative b looks like: higher bar portion, lower next return. On the BTC row, bar portion is −0.9529. A negative slope times a negative reading is a positive forecast, so that minute is a long, and the reference price moves up.
They leave that sign in prose. MACD positive means the fast average is above the slow one, and the dynamic bot uses that as a reason to mark the reference up. Bar portion positive means the close finished above the open, and the bins say the next average return is lower, so the reference moves down. Feed the raw series into the MACD slot and the center shifts the wrong way. The backtest only avoids that because the fitted slope is free to come out negative.
Bar portion is a skew computed from the candle. The old article "The Worst-Kept Secret: Imbalance Is the MM's Optimal Response, Not Alpha" argues that depth imbalance is the quote a market maker already chose, and that a positive imbalance lines up with a higher next mid. Bar portion never sees that depth. A full up-bar pushes it toward +1 and, on their bins, lines up with a lower next bar. If you have the book, skew from inventory and from imbalance. If you only have the candle, skew from the sign above.
Fit the start spread to monthly volatility
The optimized start spread rises with monthly volatility. Inside the dynamic bot the width still moves with NATR, the average true range divided by price; they name that input and do not print the expression. Separately, they run Optuna, a hyperparameter search, over October 2024 and keep the start spread, step spread, stop, and take-profit that maximize the Sharpe ratio for each of the 30 coins. Start spread is the distance from the reference price to the first order. Step spread is the extra distance out to the next order level.
They describe a straight line through monthly volatility and the optimized start spread, and they do not print the intercept or the slope. The figure prints the fit.
$$ \text{Start spread} = a + b \cdot \text{Monthly volatility} $$
The prose says the optimized start spread and the step spread are about 4 to 5 times monthly volatility. The axes use different units. Monthly volatility is the decimal on the x-axis (0.20 means a 20% month). The spread is the percent on the y-axis. Take a coin at monthly volatility 0.20. Four times 0.20 is 0.80, and the points near 0.20 on the figure sit around 0.6% to 0.9%. That 0.80 is 0.80 percent, a start spread of 80 basis points. Five times 20%, with both sides in percent, is a 100% spread, and the axis ends at 2.5%. The source's "4 to 5 times" is the slope under that mixed labeling. Use the chart's units. A same-unit reading quotes a spread a hundred times too wide.
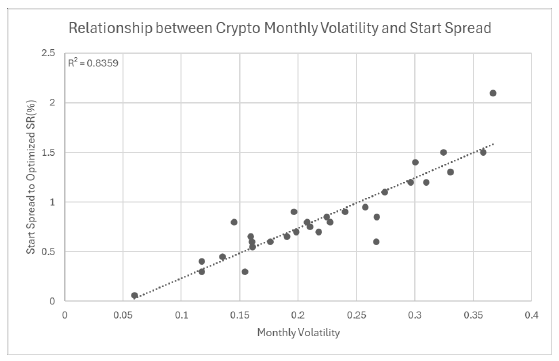
The dotted line is the 4-to-5 slope in mixed units. The point up near 2.1% at volatility around 0.36 is one coin. R-squared on that line is 0.8359, so monthly volatility lines up with about 84% of the variation in the optimized start spread. The step-spread scatter is the same idea with a looser fit, R-squared 0.7323, on an axis that tops out near 1.6%. At volatility 0.20 those points run from about 0.6% to 1.1%. The same "4 to 5 times" sentence is a rougher description there.
The stop and the take-profit do not follow. Take-profit against the same monthly volatility has R-squared 0.0011, with a flat line near 4.5% and a cloud from about 1% to 8%. Stop-loss has R-squared 0.0002, a flat line near 5%, and a cloud from about 1% to 9%. Leave both of those to a per-coin search. Volatility told the search where to put the spread. It told the search nothing about where to put the barriers.
Thirty optimized points, one month, objective equal to in-sample Sharpe. The line is a calibration sketch of that month. It is the right shape for a quoting width, and it is a thin sample to promote into a constant.
The printed horse race is fully long or fully short
The number they set next to bar portion is a directional book. Look at the line that finishes near 46%: that is bar portion over the nine test days, thirty coins added together, each sleeve fully long or fully short.
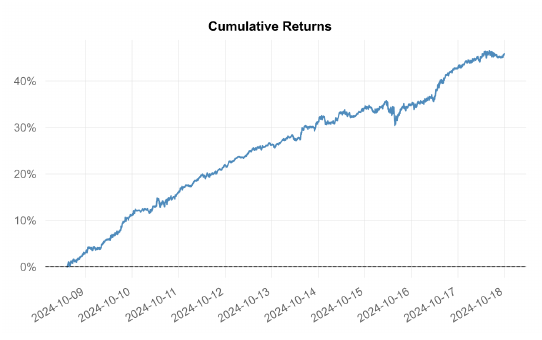
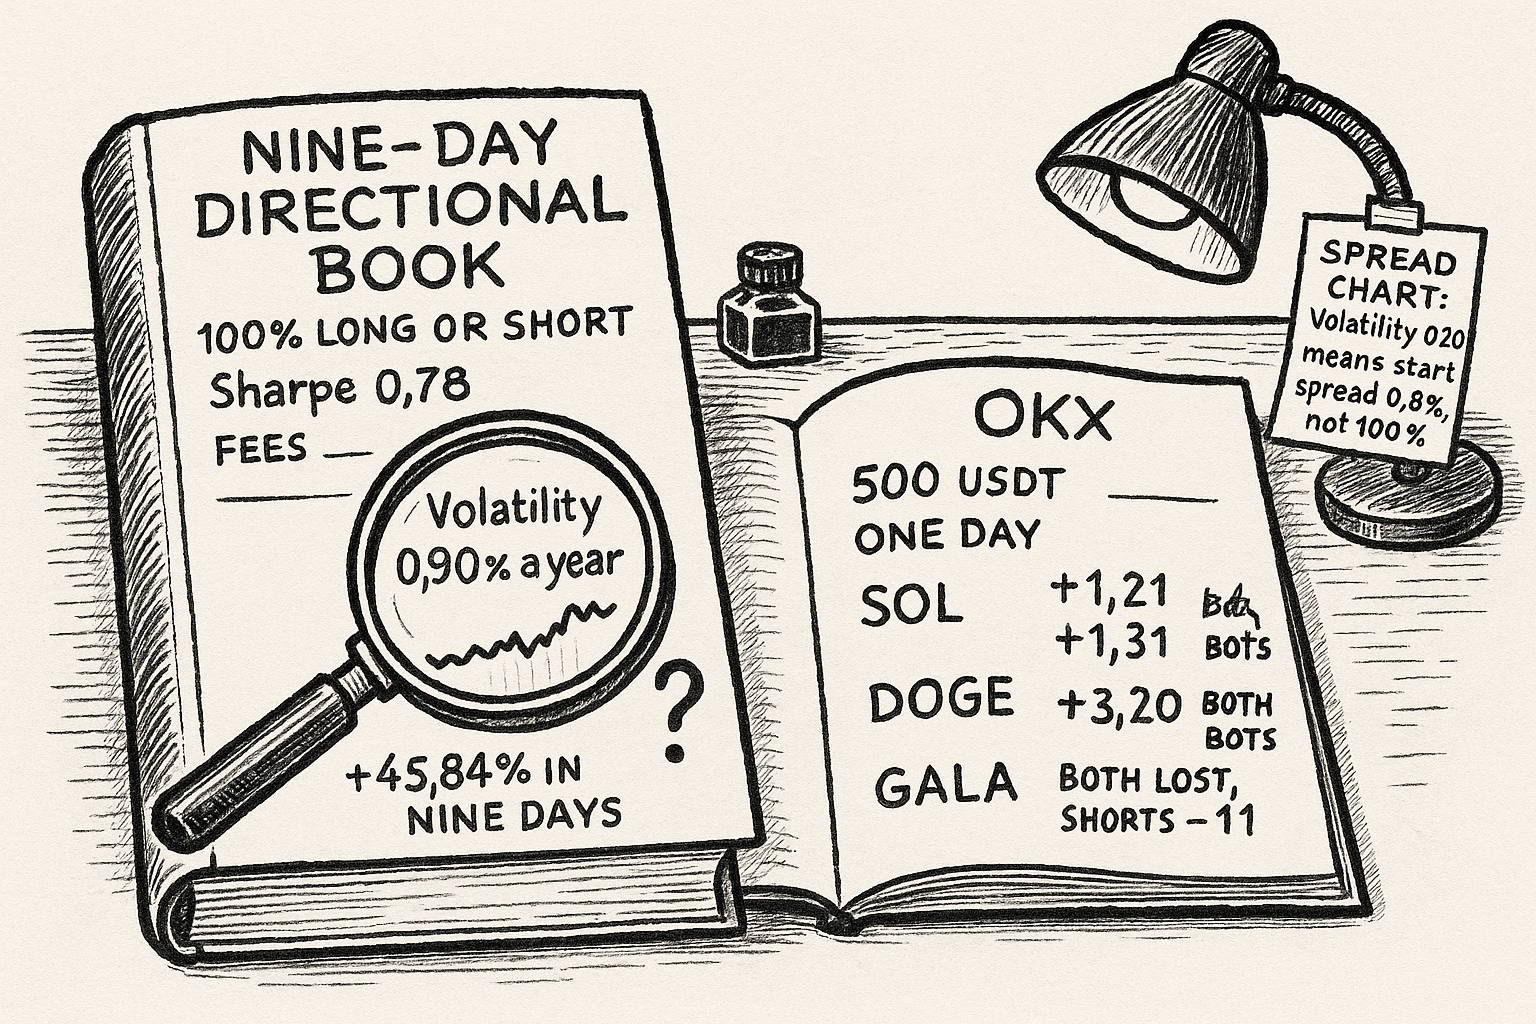
Bar portion's accumulative return is 45.84%, its Sharpe ratio is 0.78, and MACD's Sharpe ratio on the same book is −0.01. MACD's accumulative return is −0.59%, its maximum drawdown is −8.71% against bar portion's −3.94%, Sortino (mean return over downside deviation) is −0.01 against 1.14, and the volatility column prints 0.94% against 0.90%.
The balance that produces the 45.84% is the sum of the thirty coin sleeves, starting at 10,000.
$$ \text{Balance}_t = \sum_{i=1}^{30} P_{i,t}, \qquad \text{Return}_t = \frac{\text{Balance}_t - \text{Balance}_{t-1}}{\text{Balance}_{t-1}} $$
Each sleeve starts at 10,000 / 30 = 333.33. The minute return is the change in the summed balance divided by the previous sum. Their accumulative return of 45.84%, applied to the starting sum, lands on 10,000 × 1.4584 = 14,584. The chart's right edge sits near 46%, so the table and the picture agree on the gain. The MACD chart, which is the other series, chops between about −2% and +6% and ends near the table's −0.59%.
The volatility column does not agree with either picture. Scale 0.90% annualized volatility down to a nine-day horizon by the square root of the fraction of a year. That is the width you get when successive returns are uncorrelated.
$$ \sigma_{9} = 0.0090 \times \sqrt{\frac{9}{365}} $$
The square root of 9/365 is 0.1570. Times 0.0090 is 0.001413, which is 0.14%. Divide the nine-day gain by that width: 0.4584 / 0.001413 = 324. A path that rose 45.84% in nine days, with a maximum drawdown of 3.94%, is being labeled with an annualized volatility of 0.90%. MACD's path spans several percent on its own chart and is paired with 0.94%, and the two volatility prints are almost equal while the two charts are different shapes. Keep the printed 0.78, the printed 45.84%, and the printed 0.90%. Those three cannot be the mean, the volatility, and the Sharpe of one path. The source may have mis-scaled the volatility column.
Two further cuts, both from their own writeup. The directional test charges no fees, and it rebalances on one-minute bars. Their live round-trip figure is 2 × 0.02% = 0.04%. If the sign flipped on every one of the 12,959 forecast bars, that cost is 12,959 × 0.04% = 518% of notional, against a 45.84% gain. They never print the flip count. 518% is the ceiling under a flip every bar. You need the flip count before the 0.78 is a P&L. The dates disagree. They describe the sample as ending 14 Oct 2024, the chart runs from 9 Oct through 18 Oct, and 9 × 1,440 = 12,960 rows against the 12,959 they print. The training length, 51,840, matches 36 × 1,440. The test window's dates and row count do not match the sample paragraph. The 45.84% still matches the chart you can see.
The live book is one day and 500 dollars
What you can copy onto a quoter is the sign and the spread rule. Negative fitted slope, so a bar portion near −1 marks the reference price up and a bar portion near +1 marks it down. Start spread from the monthly-volatility chart, in percent, about four times the decimal volatility: 0.20 maps to about 0.8%. Five times 20%, in one unit, would be a 100% spread. Stop and take-profit stay off that chart. They still do not print the price offset, in dollars or in basis points, that a bar portion of −0.9529 is supposed to add to the reference price. Without that scale you have a direction and no size.
The live check is three OKX perpetual books, SOL-USDT, DOGE-USDT, and GALA-USDT, about 24 hours, 500 USDT of quote each, bar portion against the MACD dynamic bot, with a stop, a take-profit, and a time limit. The devices were not on one clock. They say so.
On SOL the results prose says bar portion made $1.214 and the dynamic bot lost $1.593. The backtest-versus-live table, same pair and same 500 USDT, prints live bar portion at +$1.31, which is 0.26% of 500, and the backtest at −$0.69, which is −0.14% of 500, on volume of $23,922.50 live and $33,982.37 in the backtest. The executor bars for that live bar-portion book print +1.31, while long −0.55 and short +1.85 sum to +1.30. The dynamic executor bars print −2.68, against the prose loss of $1.593. The dashboard percent on the $1.214 snapshot is 0.009%. Against the book that is $1.214 / 500 = 0.243%. Against the printed volume it is $1.214 / $23,922.50 ≈ 0.005%. Keep each exhibit's number on that exhibit. The source's SOL prints disagree, and the source may have mixed snapshots.
DOGE made money on both bots, $3.191 for bar portion and $3.216 for dynamic. The 0.249% they attach to bar portion is $3.191 divided by $1,281.98 of volume. Dynamic's 0.068% is $3.216 divided by $4,733.85 of volume. That ratio is PnL per dollar traded, a capture rate. On SOL, the 0.26% was PnL divided by the 500 USDT book.
GALA lost on both. The text says bar portion lost less. The two executor totals print about −6.56 and −9.78. Their own components sum to +4.26 − 10.83 = −6.57 and +0.96 − 10.75 = −9.79, off by a penny on the printed total. The short side is the hole in both: price spiked, the short limits stayed open, and the fade never paid them back inside the session.
The SOL market-making backtest charges 0.06%. Live, they use 0.04% and leave slippage out. The directional 0.78 charged nothing. The old article "DRL Market Making With a Periodic Signal and Real Latency" puts a periodic signal inside a quoter that also has to survive latency and inventory. This paper's clean number is a full-size long or short with no latency and no book. I am against putting size on either figure. Use bar portion as a one-minute reversal skew when the candle is all you have, with the slope flipped relative to MACD, and a start spread read off monthly volatility in the chart's units. If the book is on the screen, the skew to compute is still inventory and imbalance.
KEY POINTS
- Compute bar portion as close minus open, divided by high minus low, on the one-minute perp candle. The paper's first BTC-USDT row prints −0.9529. A zero-range bar is undefined; set it to 0.
- Fit a negative slope before you skew the reference price. Next-bar returns fall as bar portion rises on a proportion 0.73 of the 30 coins. A positive slope in the MACD slot marks the center up after an up-bar.
- Set the start spread from monthly volatility in the chart's units. Volatility of 0.20 maps to a start spread near 0.8%.
- Leave the stop and the take-profit off monthly volatility. Take-profit R-squared is 0.0011, and the stop-loss scatter is flat beside it.
- Do not fund the quoter off the 0.78 Sharpe. That book is fully long or fully short and charges no fees.
References
- The Three Pillars of Market Making: Fair Price, Spread, Skew
- The Worst-Kept Secret: Imbalance Is the MM's Optimal Response, Not Alpha
- DRL Market Making With a Periodic Signal and Real Latency
- Market Making in Crypto (Stoikov, Zhuang, Chen, Zhang, Wang, Li, and Shan)
A note on AI. The ideas, research, analysis, and conclusions in this article are my own. I use AI tools to help with editing and wordsmithing, because English is not my first language, and I am not shy about that. AI-generated ideas and AI-assisted writing are not the same thing: the first is empty slop from a generic prompt, the second is a tool for communicating years of real research more clearly. Judge the work by its substance, not by whether software helped polish the prose.