6.39 Why Traders Should Analyze Indicators Mathematically
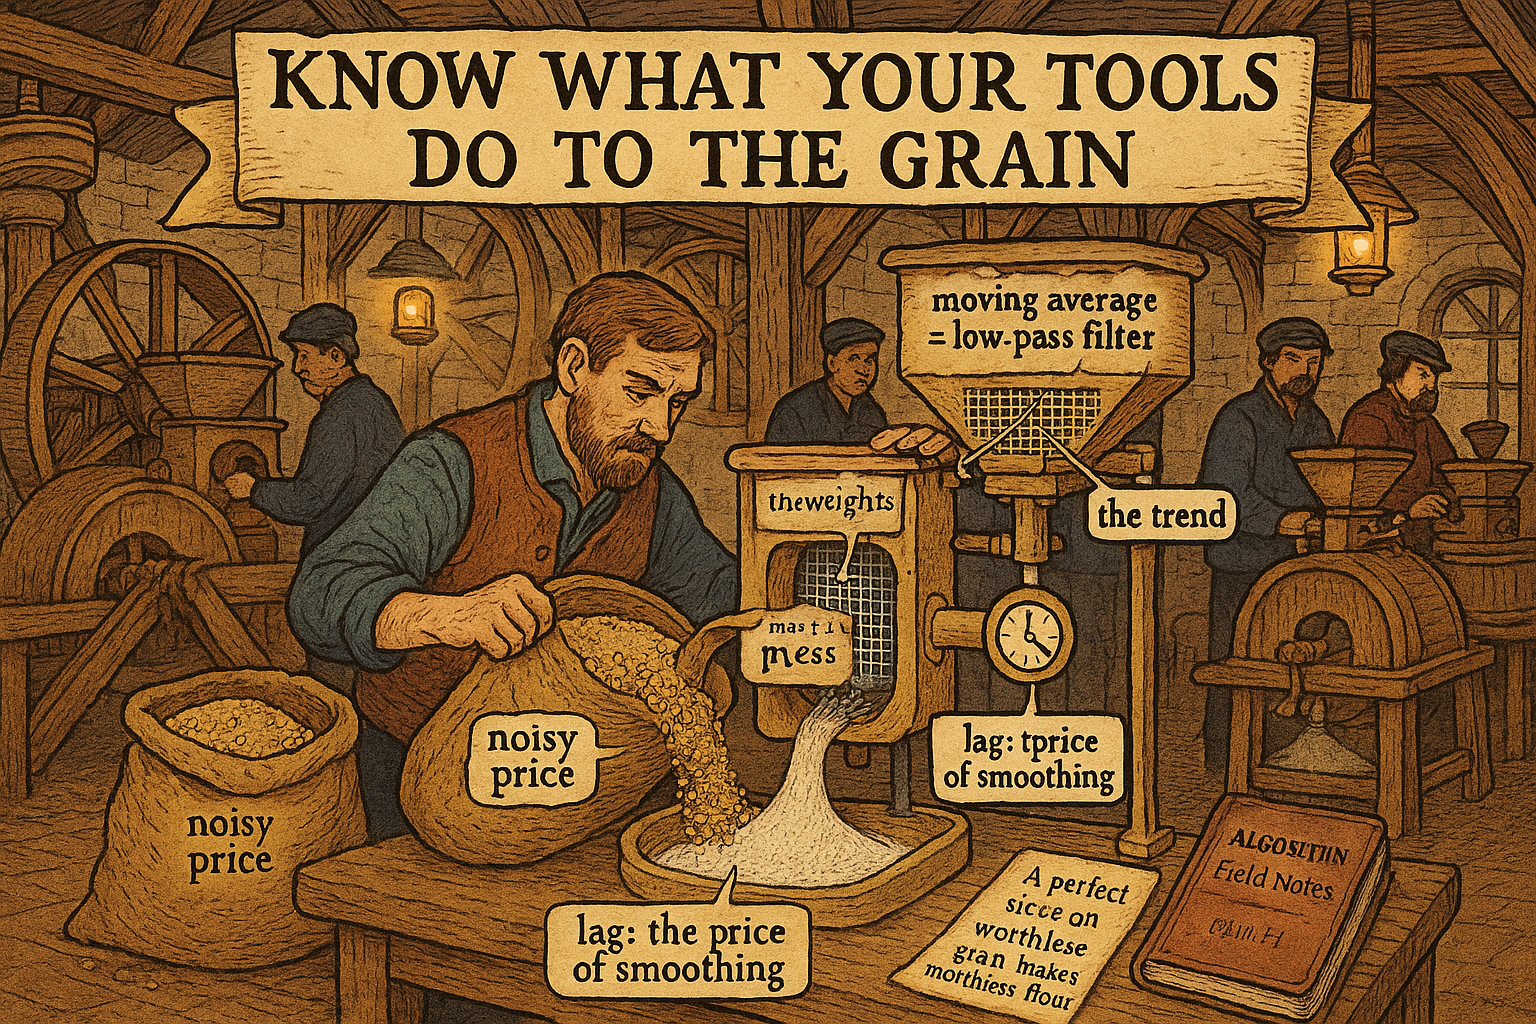
Every moving average is a low-pass filter, and its lag is the price of stripping noise from a causal signal. Read indicators as filter weights, not chart lines, and stop fooling yourself about them.
Traders use moving averages, oscillators, and momentum indicators every day, and almost none of them can tell you what those indicators actually do to the data. They know an indicator's recipe, the formula, the lookback, and they treat its output as a black box that produces buy and sell hints, without ever asking what mathematical operation it performs. This is a strange gap, because every common indicator is a well-understood signal-processing operation in disguise, and seeing it as one explains the indicator's behavior, its lag, and its failures far better than any amount of charting. No trader seems to analyze their indicators mathematically or characterize them, and that refusal leaves obvious knowledge on the table. This is the methodological close of the pillar, the habit of mind that the whole econophysics run has been arguing for.
A moving average is a filter
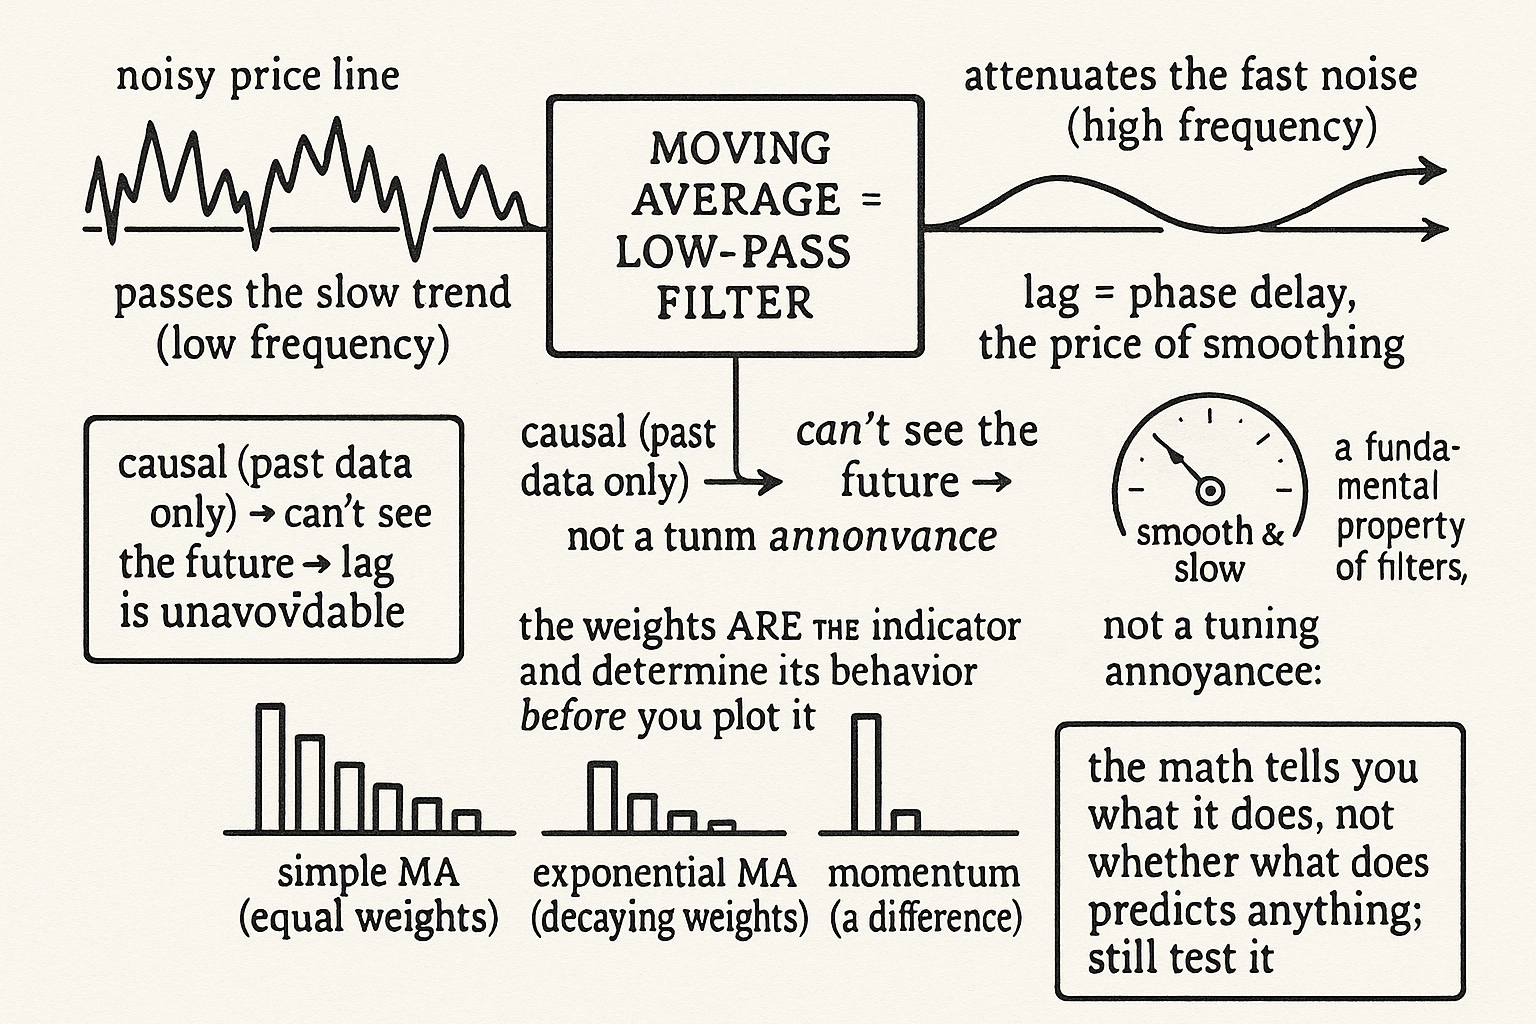
Start with the most common indicator. A trending indicator, any moving average or smoother, takes a noisy price series and produces a smoother one by averaging recent values, and that operation has a precise name in signal processing: it is a low-pass filter. It passes the low-frequency component of the price, the slow trend, and attenuates the high-frequency component, the fast noise. Seeing a moving average as a low-pass filter is not a metaphor; it is exactly what the math does, and it immediately explains why moving averages behave the way they do.
Once you see the filter, the indicator's properties stop being mysterious. The reason a moving average lags is that filtering introduces phase delay: separating the slow trend from the fast noise takes information from the past, so the filtered output necessarily arrives later than the price, and a smoother filter, more lag, while a more responsive filter passes more noise. The eternal trade-off every trader feels between a moving average that is smooth-but-slow and one that is fast-but-noisy is not a tuning annoyance, it is a fundamental property of filters, the inescapable relationship between smoothing and delay. You cannot tune it away because it is built into what filtering is.
Causality is the constraint that creates the lag
The signal-processing view also explains why the lag cannot be removed, and the reason matters. An ideal filter that removed noise with no phase lag would need to use future data, because separating signal from noise without delay requires seeing what comes next. Traders cannot do that; an indicator must be causal, using only past and present data, since no future prices are available. That causality constraint is exactly what forces the lag: a causal filter cannot know the future, so it cannot anticipate the trend, so its output trails the price.
$$ y_t = \sum_{k=0}^{N} h_k \, x_{t-k} $$
Every causal indicator has this form: the output is a weighted sum of current and past prices, with the weights defining the filter. A simple moving average makes all the weights equal; an exponential moving average makes them decay geometrically into the past; a momentum indicator takes a difference of past values. The weights are the indicator, and they completely determine its behavior, its lag, its smoothing, its response to a sudden move. Reading an indicator as its weight pattern, rather than as a chart line, tells you what it will do before you ever plot it, because the frequency response, how it treats slow trends versus fast noise, follows directly from the weights.
What this habit buys you
Analyzing indicators mathematically changes how you build and combine them. Instead of bolting together indicators by trial and error and keeping whatever backtests well, the overfitting trap this whole series warns against, you can reason about what each one does and choose them for their actual properties. If you want to extract a trend at a certain timescale, you choose or design a filter with the right frequency response, rather than sweeping moving-average lengths until one looks good. If two indicators backtest similarly, the math tells you whether they are doing nearly the same operation, in which case combining them adds nothing, or genuinely different ones, in which case they might diversify. This is the indicator-level version of "Why Portfolio Construction Is Part of the Signal": understanding the operation lets you compose deliberately instead of by accident.
The honest limit keeps this from becoming its own delusion. Understanding an indicator mathematically tells you precisely what it does to the data; it does not tell you whether what it does has any predictive value, because a perfectly characterized filter applied to a series with no exploitable structure produces a perfectly characterized worthless signal. The math is necessary and not sufficient, the same refrain as the rest of this pillar: knowing your indicator is a low-pass filter with a given lag is real knowledge, and it still has to be paired with honest out-of-sample testing and cost accounting to become an edge. The value of the mathematical habit is that it stops you from fooling yourself about what an indicator is, removes the mystery that lets bad indicators hide, and lets you build on understanding rather than on the accidents of a backtest. It is the discipline of knowing your tools, which is the least a serious trader owes the work.
Visualizing indicators as filters
KEY POINTS
- Traders use indicators daily without knowing what mathematical operation they perform. Every common indicator is a well-understood signal-processing operation, and seeing it as one explains its behavior better than charting.
- A moving average is a low-pass filter: it passes the slow trend and attenuates the fast noise. That is exactly what the math does, not a metaphor.
- The filter view explains the lag. Filtering introduces phase delay, so a smoother filter lags more and a faster one passes more noise. The smooth-but-slow versus fast-but-noisy trade-off is a fundamental property of filters, not a tuning annoyance.
- Causality creates the lag. An indicator must use only past and present data, and a causal filter cannot see the future, so it cannot anticipate the trend and its output trails the price.
- Every causal indicator is a weighted sum of current and past prices, and the weights are the indicator. A simple average uses equal weights, an exponential one uses decaying weights, momentum takes a difference, and the weights fully determine the behavior.
- The habit lets you choose and combine indicators by their actual properties instead of by trial and error. The math tells you what an indicator does, not whether it predicts anything, so it is necessary but not sufficient and still needs honest testing.
References
- Systematic Trading - Robert Carver (Amazon)
- Trading Systems - Urban Jaekle Emilio Tomasini (Amazon)
- Portfolio Optimization: Conditional Value-at-Risk and Drawdown Constraints
- Maximum Drawdown, Recovery, and Momentum
- Measuring Strategy‑Decay Risk: Minimum Regime Performance and the Risk of Losing Alpha
- Factor Investing and Asset Allocation
- A Primer for Investment Professionals: Risk and Return in a Multi‑Asset World
- Volatility spillover among the sectors of emerging and developed
- Design of optimum filters for signal processing with silicon drift
- AlphaCrafter: A Full-Stack Multi-Agent Framework for Cross ... - arXiv
- A Theory of Technical Trading Using Moving Averages
- Time-Series Momentum and Moving Average Trading Rules
- Trend following with momentum versus moving averages
- Measuring business cycles: Approximate band-pass filters for economic time series
- Approximate Band-Pass Filters for Economic Time Series
- An Introduction to Wavelets and Other Filtering Methods in Finance and Economics
- Dynamics of moving average rules in a continuous-time financial market model
- Filtering economic time series: On the cyclical properties of the Hodrick-Prescott filter