2.64 Price Intensity: Reading Intrabar Conviction
Most indicators keep the close and toss the rest of the bar. Price intensity reads open-to-close travel against the true range, a pure intrabar conviction gauge, and the volume-free version is a clean mean-reversion feature once smoothed and normalized.
Most indicators throw away three quarters of every bar. They take the close and discard the open, the high, and the low, which means they ignore the entire story of what happened between the bell rings. Price intensity, David Bostian's construction, reads that discarded story: it asks how decisively the bar traveled from open to close relative to how far it sprawled in total. The old article "Why Most Indicators Should Be Transformed Before Modeling" insisted that same-bar OHLC differences are some of the few near-raw quantities that survive as features, and intensity is the sharpest of them, a pure read on intrabar conviction.
Open-to-close, scaled by the true range
The raw intensity is the net distance price covered from open to close, divided by the largest of three spans that capture the bar's full reach including its gap from the prior close.
$$ \text{Raw PI} = \frac{C - O}{\max\big(H - L,\; H - C_1,\; C_1 - L\big)} $$
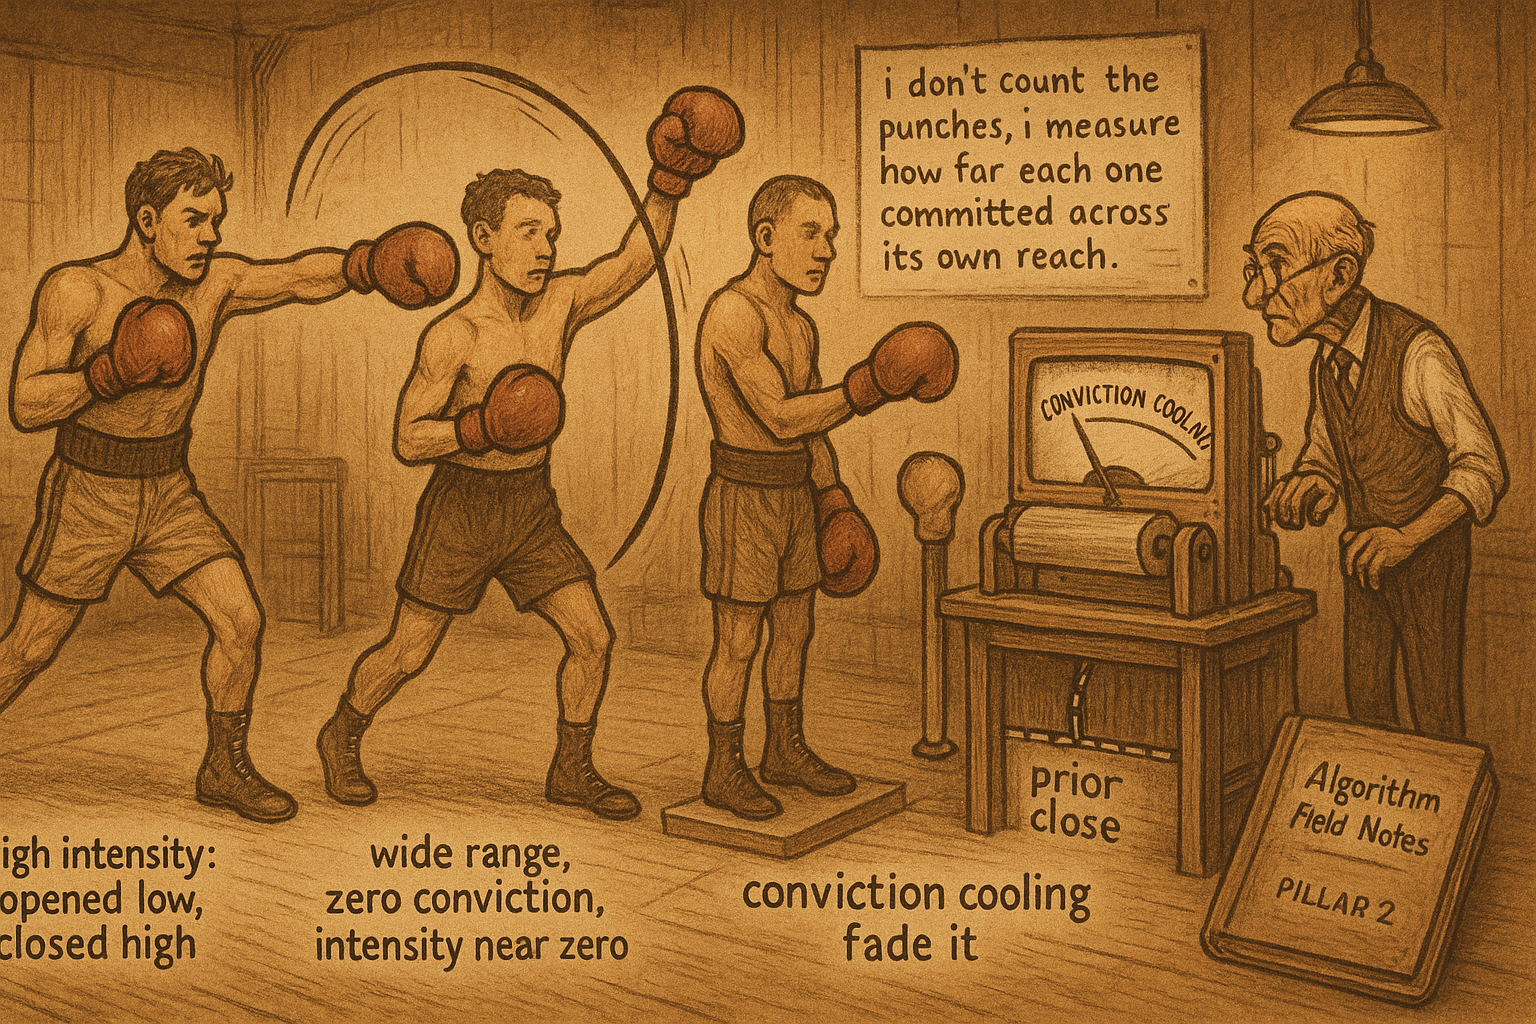
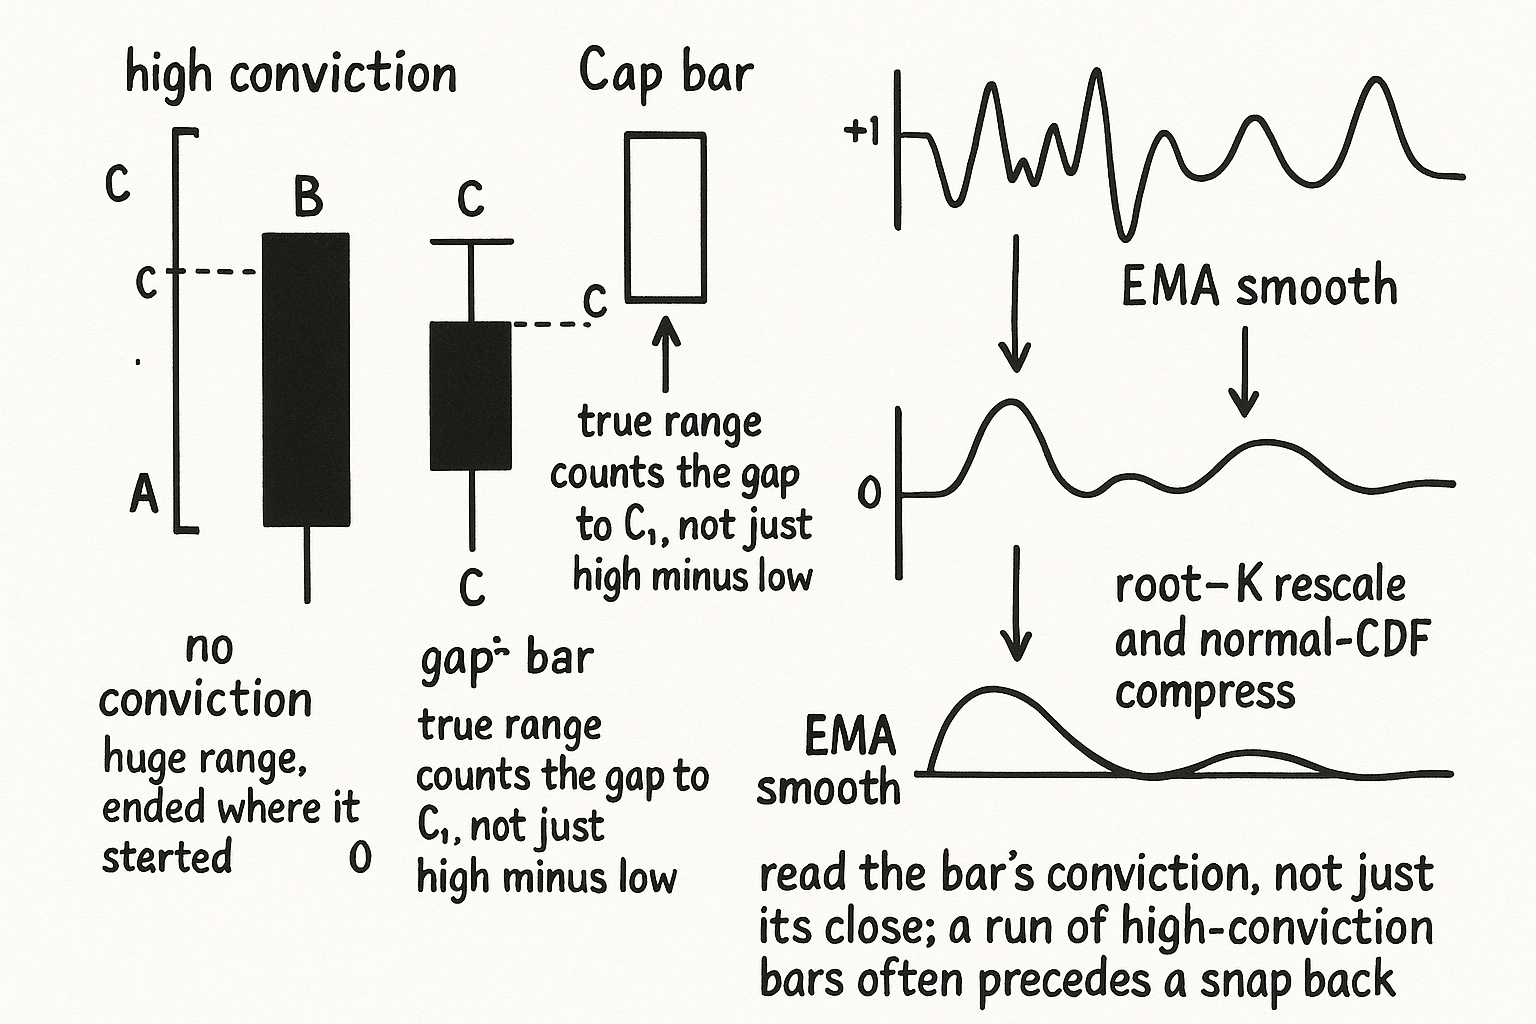
The terms C and O are this bar's close and open, H and L its high and low, and the C with the subscript is the prior bar's close. The numerator is the directional payload: how far, and which way, price ended up versus where it started the session. The denominator is the true range, the widest of the bar's own high-low span and the two spans that reach back to the prior close, so a gap that opened the bar away from yesterday is counted as part of the territory covered. Divide one by the other and intensity lands in minus one to plus one. A reading near plus one means the bar opened low, closed high, and spent its whole range pushing in that one direction, pure buying conviction. Near zero means price thrashed across a wide range and ended where it began, a lot of motion and no resolve.
The volume-free version is the useful one
Bostian's original intensity multiplied this by volume, on the logic that a conviction move backed by heavy trade means more than the same move on thin trade. Strip the volume out and you get a cleaner indicator. The volume-free intensity still captures the intrabar conviction, it is far easier to normalize because it is already bounded, and it turns out to be effective for mean reversion: a string of high-conviction bars in one direction is often the setup for a snap back, not a reason to chase. Dropping volume also sidesteps the non-stationarity that volume drags in, since traded volume trends, spikes, and shifts its whole distribution across years in ways that contaminate any indicator built on it.
The raw intensity has one rough edge: it swings wildly from bar to bar, because a single indecisive bar can flip it from near plus one to near minus one regardless of the larger drift. So smooth it with an exponential average, which is the standard tool here, to expose the underlying tendency of intrabar trend rather than the per-bar jitter.
$$ \text{NPI} = 100 \cdot \Phi\!\big(\sqrt{K}\cdot \text{EMA}(\text{Raw PI})\big) - 50 $$
The smoothed intensity then gets normalized. The EMA term is the exponentially smoothed raw intensity, K is the effective smoothing length, and multiplying the smoothed value by the square root of that length restores a consistent scale, the same random-walk root-length correction the moving-average difference used, so a longer smoother does not silently shrink the indicator's range. The normal CDF, written here as capital phi, compresses the result into a bounded band and the final scaling recenters it at zero. The whole chain is the old transform article's recipe applied to one clean primitive: take a same-bar OHLC quantity, smooth the jitter, rescale for lookback independence, and squash to a bounded model-ready feature.
Where it helps and where it lies
Price intensity is an intrabar-conviction read, not a trend or a price level, and that narrowness is its strength and its limit. It tells you how hard a bar pushed relative to its own range, so it is most useful as a mean-reversion feature, flagging when conviction has run hot enough to invite a reversal, and as a confirmation overlay on a separate directional signal. It does not know where price is or where the trend points, so leaning on it alone is asking a conviction gauge to do a job it was never built for. The smoothing length is a real parameter that sets how much per-bar jitter you suppress against how much lag you accept, and the normalization must be computed causally or the bounded, tidy-looking feature is quietly lookahead-poisoned. Same-bar OHLC construction keeps it honest and stationary, but stationary is not the same as predictive, and intensity still has to clear that bar on your instrument before it earns a slot in the feature set.
KEY POINTS
- Price intensity reads the part of the bar most indicators discard: open-to-close net travel divided by the true range, where the true range is the widest of the high-low span and the two spans back to the prior close, so gaps count.
- It lands in minus one to plus one. Near plus one is a bar that pushed one direction across its whole range (conviction); near zero is wide thrashing that ended where it began (no resolve).
- The volume-free version is the better feature: it stays bounded and easy to normalize, works well for mean reversion, and avoids the non-stationarity that volume drags in.
- Raw intensity is jumpy, so smooth it with an EMA to expose the intrabar tendency, then multiply by the square root of the smoothing length for scale consistency and compress with the normal CDF, the same transform chain from the old indicator-transform article.
- It is an intrabar-conviction gauge only, best as a mean-reversion or confirmation feature; it carries no trend direction. The smoothing length is a real lag-versus-noise knob and the normalization must be causal.