9.43 Who Profits From Prediction? Execution, Not Information
Polymarket profit per contract is the side you picked plus the price you paid. Score the fill on the previous trade: forecasting and execution are separate, and the entry persists.

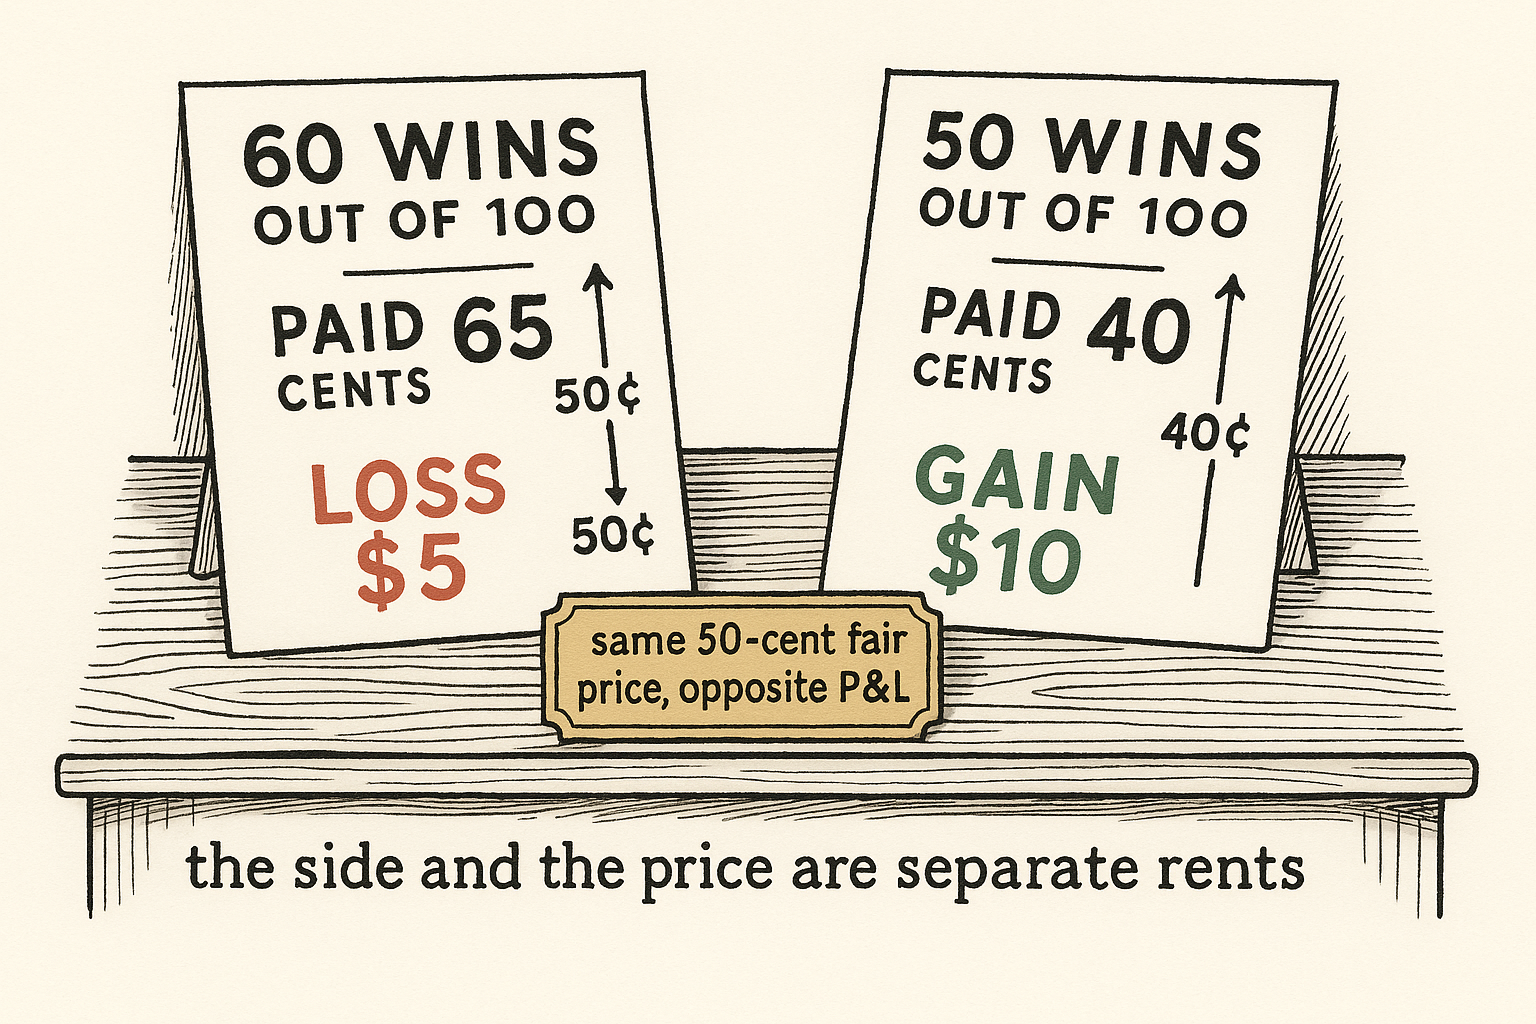
Joshua Della Vedova splits a Polymarket buy into the side you were on and the price you paid, two rents that can sit in different wallets. Take 100 contracts in a market whose average price is 50 cents. A retail wallet that wins 60 of them and pays 65 cents gets $60 back on $65 spent. A bot that wins 50 and pays 40 cents gets $50 back on $40 spent. The accurate wallet loses $5, and the coin-flip wallet makes $10.
Profit on a buy is the side plus the price
This tape is a central limit order book on Polygon, zero-sum, with a maker and a taker on every matched fill. The LMSR cost function in the older prediction-market pieces is a different mechanism, and none of that pricing carries onto these fills. Expected profit per contract is Della Vedova's equation 1.
$$ E[\Pi_i] = (\theta_i - \bar{p}) + (\bar{p} - p_i^{\text{entry}}) - \kappa $$
The first parenthesis is the directional rent. Theta is the expected payoff on the side wallet i took: 1 when that side wins, 0 when it loses, and at wallet level the fraction of resolved trades on the winning side. Subtract the fair price, p-bar, and you have what the forecast was worth against the reference. The second parenthesis is the execution rent, the same fair price minus the price the wallet paid. A fill under the reference is a positive execution edge. Kappa is an explicit fee. Polymarket charged no trading fee from November 2022 through February 2026, so the measured split drops kappa, and the spread you cross already sits inside the execution term. The card is a buy. A sell reverses the sign: the seller's profit on the contract is the price received minus the outcome.
Same fair price, 50 cents, kappa at zero. The retail wallet has theta of 0.60 and an entry of 0.65. Directional rent: 0.60 minus 0.50 = 0.10. Execution rent: 0.50 minus 0.65 = −0.15. Sum: −0.05 a contract. On 100 contracts that is 100 times −0.05 = −$5. You can count it from the tickets. Sixty winners pay back $1 each, $60. The book cost 100 times $0.65 = $65. The bot has theta of 0.50 and an entry of 0.40. Directional rent is zero. Execution rent is 0.50 minus 0.40 = 0.10. On 100 contracts that is +$10: fifty winners pay back $50, and the book cost $40. Inserting the fair price and subtracting it again leaves the total alone. It only decides which rent is credited.
A hit rate above 50% is the price already in the contract
Directional accuracy is the share of resolved trades where the wallet bought a token that settled at $1 or sold a token that settled at $0. With no forecast, that share is 50% only if you ignore the price. A contract at 70 cents, bought as the favorite, wins about 70% of the time when the price is a calibrated payoff. Excess accuracy, Della Vedova's section 3.7, subtracts that baseline one trade at a time.
$$ \text{Excess Accuracy} = \text{Correct} - \max(p,\, 1 - p) $$
Correct is 1 or 0 on the trade. The max is the hit rate from always taking the side priced above one half. The wallet number is the average of that gap over resolved trades. It strips the mechanical link between a high price and a high hit rate.
Buy the favorite at 0.80. The max is 0.80. If the price is calibrated, Correct averages 0.80, the gap averages zero, and expected profit is 0.80 times (1 − 0.80) plus 0.20 times (0 − 0.80) = 0.16 − 0.16 = 0. A win still pays 20 cents. It pays on the schedule the price already sold you. The longshot is the typical wallet. Equal-weighted mean entry price is $0.388. Buy at 0.39. The favorite is the other side, so the max is 0.61. A wallet that is correct half the time has excess accuracy 0.50 − 0.61 = −0.11 on that trade. Mean excess accuracy across wallets is −0.201. Median is −0.159. Every type is negative, bots at −0.242 and active retail at −0.184, equal-weighted. Three quarters of wallets lose to the rule "buy whatever is priced above one half."
Trade-weighted, active retail hits 51.3% at a volume-weighted entry of $0.520. Against the side they chose, chosen-side excess accuracy is Correct minus the price on a buy and Correct minus one minus the price on a sell. Della Vedova prints −0.008 for active retail and −0.004 for bots. That is 0.8 cents and 0.4 cents a contract under the price they paid. The 51.3% is a wallet that showed up after the price had moved, and still missed that price.
Inside one type, a higher hit rate does not purchase a lower entry. On wallets with at least 50 resolved trades, entry price rises with accuracy for bots, slope +0.190, and for sophisticated wallets, slope +0.092. Sophisticated here means volume above $10,000, a volume Herfindahl below one half (the sum of squared market-volume shares), and more than 30 active days. Hold the market fixed and the bot slope is still +0.021: inside the same contract, the more accurate bots pay more. Active retail's raw slope is −0.166, and market fixed effects shrink it to −0.057. Market-by-price-decile fixed effects pull the slopes toward zero. A single skill that both picks the side and gets you in early would have left a sturdy negative slope. The cleaned slopes sit near zero, and the bot slope is positive.
A VWAP of your own fills invents a tradeoff
The fair price is a choice, and the usual choice writes your own past fills into both rents. Backward VWAP is the volume-weighted average of buy-side trades strictly before the fill. Your earlier clips in that market sit in the average that then grades you. The lagged price is the one trade immediately before yours. It shares no price with your entry. Equation 2 sets δ to the wallet's average gap, VWAP minus lagged price.
$$ \theta_w^{V} = \theta_w^{L} - \delta_w, \qquad \varepsilon_w^{V} = \varepsilon_w^{L} + \delta_w $$
Theta-V and epsilon-V are the wallet's average directional and execution components under VWAP. The L versions use the lagged price. Lift the benchmark by δ and you move δ out of direction and into execution. The sum is unchanged, because the fair price cancels: outcome minus entry, on a buy.
His winning fill at $0.40. Backward VWAP is $0.60. The lagged trade is $0.50. Under VWAP, direction is 1 − 0.60 = 0.40 and execution is 0.60 − 0.40 = 0.20. Under the lagged price, direction is 1 − 0.50 = 0.50 and execution is 0.50 − 0.40 = 0.10. Both totals are 0.60. Delta is 0.10, and the VWAP parked it in execution.
When the clean components are uncorrelated and δ is uncorrelated with both, the covariance of the VWAP components equals minus the variance of δ. The regression slope he writes in section 2.4 is that covariance scaled by the contaminated variance of the directional piece.
$$ \hat{\beta}^{V} \approx -\frac{\mathrm{Var}(\delta)}{\mathrm{Var}(\theta^{L}) + \mathrm{Var}(\delta)} $$
The printed full-sample moments are a variance of 0.0174 on the clean directional component and 0.0037 on δ. The denominator is 0.0211. Then −0.0037 / 0.0211 = −0.175. The paper states the bound as −0.176. That is rounding on the printed moments. He calls −0.176 within one percent of the empirical VWAP slope, −0.178. The relative gap on his stated bound is 0.002 / 0.178 = 1.1%. The printed bound stays −0.176. The moments produce −0.175.
Hold the sample still and clean the benchmark. The pooled slope of execution on direction, type fixed effects, is −0.178 under backward VWAP, with an R-squared of 0.179. It is −0.013 under a local VWAP of the last 50 buys. It is 0.000 under the lagged price, with an R-squared of 0.001. A forward VWAP that skips the five trades nearest the fill and averages the following fifty prints +0.019. That column regresses execution on excess accuracy, a different right-hand side, and it is still a near-zero slope. Within type the VWAP slopes are positive: +0.089 for bots, +0.237 for sophisticated wallets, +0.158 for active retail. The pooled slope is negative only because casual and one-shot wallets pull it down. Under the lagged price the within-type slopes are −0.002, 0.000, and 0.000. The Pearson correlation with no type control falls from 0.40 to 0.03. Pool the tourists and the sign flips. Clean the benchmark and both readings go to zero.
The lagged trade is the same wallet on 72% of resolved trades, mostly one resting order filling in chunks. Self-trades are 785 of 237.75 million in his footnote, a wider count than the 222 million trades in the analysis sample. Restrict the cross-skill regression to wallets whose lagged observations are mostly someone else, same-wallet share under 0.10, and the slope is +0.001.
Ten points of accuracy are worth 11.6 cents at 50 cents
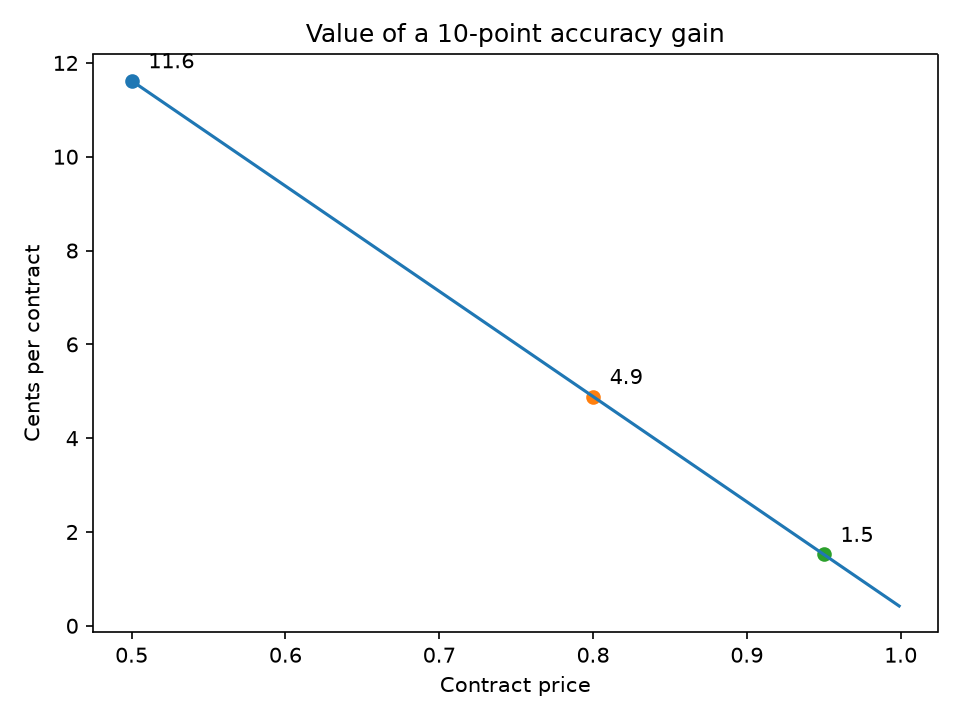
Price distance is the absolute gap between the trade price and one half. A price near 0 or 1 has already spent the forecast. Table 7, column 3, on 55.4 million wallet-market cells weighted by trade count, is the regression of total edge in dollars per contract on accuracy, price distance, and their product.
$$ \text{Edge}_{w,m} = \alpha + \beta_1 \text{Accuracy}_{w,m} + \beta_2 \text{PriceDist}_{w,m} + \beta_3 (\text{Accuracy}_{w,m} \times \text{PriceDist}_{w,m}) $$
Beta-one is 1.162 and beta-three is −2.244. Accuracy and price distance are both fractions of one, so each coefficient is in dollars per contract. Beta-three multiplies the product of the two fractions. The marginal value of accuracy, in dollars per contract per unit of accuracy, is beta-one plus beta-three times price distance. A ten-point gain is 0.10 of that.
At 0.50 the distance is 0. Then 0.10 times 1.162 = 0.1162 dollars, 11.6 cents. At 0.80 the distance is 0.30. Then 0.10 times (1.162 − 2.244 times 0.30) = 0.10 times 0.4888 = 0.04888 dollars, 4.9 cents. At 0.95 the distance is 0.45. Then 0.10 times (1.162 − 2.244 times 0.45) = 0.10 times 0.1522 = 0.01522 dollars, 1.5 cents. A buy at 0.95 has 5 cents of upside left if you are right every time, and the ten-point gain is worth 1.5 cents of that 5. The fitted line uses absolute distance, so a price of 0.05 receives the same 1.5 cents as a price of 0.95, while a correct buy at 0.05 can still pay 95 cents. The 5-cent ceiling belongs to the favorite at 0.95. The old article "Bayesian Edge in Log-Odds: Better, Earlier, Calibrated — or It's Noise" keeps earlier as one of three gates. A forecast that clears the other two and arrives at 95 cents is worth 1.5 cents a contract per ten points of accuracy.
Look at the left-hand point, 11.6 cents. That is where ten points of accuracy still have room. The right-hand point is 1.5 cents, at a price of 0.95.
The interaction lifts the R-squared from 0.454 to 0.775. Wallet-market edge moves almost automatically with whether the cell was correct, so a fat R-squared on raw accuracy is partly an identity. Across wallets, accuracy and ROI have a Pearson correlation of 0.17. Square that: 0.17 times 0.17 = 0.0289, under 3% of who profits. The paper's wallet-level ROI specifications put accuracy under 5% of cross-sectional profitability. Use the price-distance slope. Leave the level fit alone.
Bot edge at entry, realized edge per contract at a given distance from resolution, is large and positive more than a year out, about zero at 7 to 14 days, and negative into the close. Retail and casual wallets do not share that shape. Their earliest trades are the adversely selected ones, and their last-week trades sit on contracts already priced near 0 or 1, with a thin dollar margin.
Execution repeats. Accuracy does not predict the next fill
Wallets with at least 50 resolved trades, 552,167 of them, are cut at the chronological midpoint. Second-half skill is regressed on first-half skill. Equation 8 prints no intercept.
$$ \theta_{w,2} = \rho_{\theta} \cdot \theta_{w,1} + \nu_w, \qquad \varepsilon_{w,2} = \rho_{\varepsilon} \cdot \varepsilon_{w,1} + \omega_w $$
Rho-theta is the slope from first-half directional accuracy to second-half accuracy. Rho-epsilon is the same object for execution edge, fair price minus entry, in dollars per contract. Applied to levels, 0.270 times a first-half accuracy of 0.50 is 0.135. A regression with an R-squared of 0.068 is not forecasting that a 50% wallet prints 13.5% in the second half. The estimate carries an intercept, or the halves were demeaned, and the printed equation left the intercept out. The card follows that equation. The slope below is on the deviation. Ten percentage points of first-half accuracy line up with 2.7 points of second-half accuracy. One cent of first-half lagged execution edge lines up with 0.434 cents in the second half.
Look at the execution-persistence pair, second group from the left. The dotted bar is backward VWAP, 0.080. The solid bar is the lagged price, 0.434. Then look at the cross-skill pair, third group. The solid bar sits on 0.000. First-half accuracy does not move second-half execution once the benchmark is the previous trade.
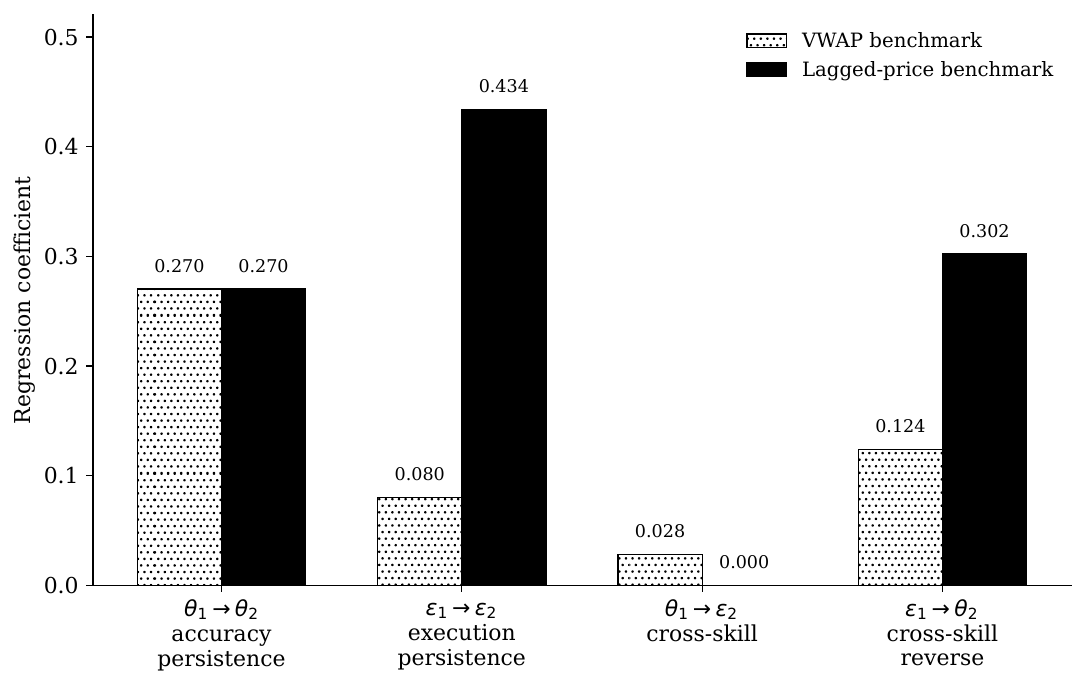
The rightmost solid bar, 0.302, is a unit mismatch. That slope predicts second-half accuracy from first-half lagged execution. Execution is in dollars per contract. Accuracy sits between 0 and 1. One cent is 0.01 dollars, and 0.302 times 0.01 = 0.00302, about three tenths of a percentage point of accuracy. The R-squared on that regression is 0.000. The standardized coefficient is 0.008. The bar is tall because the plot puts a dollar slope next to a probability slope.
Accuracy persistence is 0.270 under both benchmarks, R-squared 0.068. Lagged execution persistence has an R-squared of 0.217. The two execution slopes are in a ratio of 0.434 / 0.080 = 5.43. A VWAP that contains your own fills takes a durable entry skill and reports it as almost noise. He also says a variance-weighted blend of the 0.434 and of the gap's own persistence predicts a VWAP slope of 0.079, against 0.080 observed. The half-sample variances behind 0.079 are not printed with that sentence, so that match stays his. The 5.43 uses only the two bars.
What repeats in accuracy is a level. Some wallets sit near 52%, some near 48%. No type clears the price-implied benchmark. A persistent 51% is a persistent miss of the price.
The coin flip is the only book in the black
Look at the circle. It is the only marker above the zero line, and it sits on 50% accuracy. The triangle to its right is above 50% and below zero.
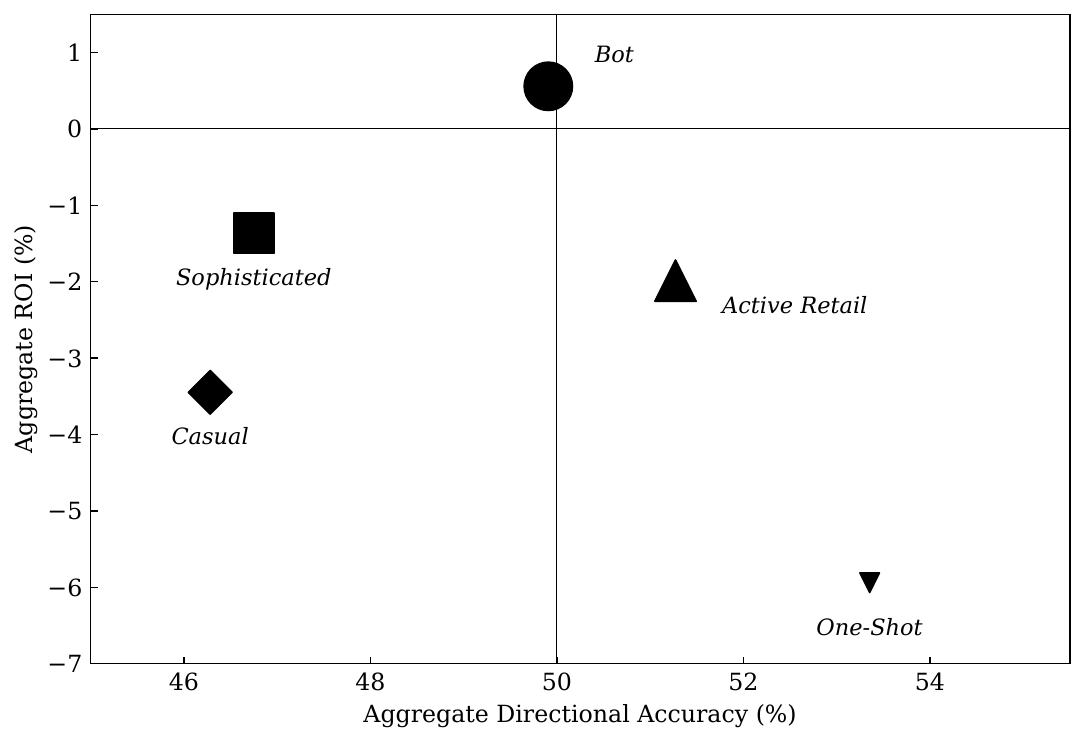
The figure is the trade-weighted aggregate, November 2022 through February 2026, 222 million resolved trades. The circle is bots: more than 50 trades a day, or more than 1,000 trades in total. Accuracy 49.9%, ROI +0.56%. The triangle is active retail, 10 to 1,000 trades after the sophisticated wallets have already been taken out. Accuracy 51.3%, ROI −1.99%. On the 229,457 markets where both types trade, the execution gap Della Vedova reports is 0.80 cents a contract, and he says that matches the full-sample gap. Those three are the comparison.
The rest of the grid in one sentence. Sophisticated wallets lose $38 million at −1.37% ROI and 46.8% accuracy, casual wallets lose $14 million at −3.45%, and one-shot wallets, the inverted triangle, are the most accurate type at 53.4% and the worst ROI at −5.94% on a $2 million loss. Bot profit is +$133 million and active retail is −$79 million. The five dollar sums are +133, −38, −79, −14, and −2, and they add to zero, which is the fee-free book.
Read the cents next to those ROI figures with the weighting in mind. Total edge in the same table is trade-weighted: bots +0.002 dollars a token, which is +0.2 cents, and active retail −0.006 dollars, which is −0.6 cents. That total is outcome minus entry. The fair price cancels, so the total does not depend on VWAP versus lagged price. The split does. Entry price is volume-weighted, $0.522 for bots. ROI is dollars of P&L over dollars of volume. Divide the trade-weighted edge by that entry and you get 0.002 / 0.522 = 0.38%, while 133 million / 23.93 billion = 0.56%. The per-trade edge and the dollar ROI are different averages. Equal-weighted across bot wallets, ROI is −2.28% and total edge is −0.006 dollars. The typical bot wallet loses. The circle is the trade-weighted book.
Active retail's printed components are −0.003 dollars directional and −0.004 execution. They add to −0.007. The printed total is −0.006. The tenth of a cent is in the source table. The printed total stays −0.6 cents.
Drop the ten bot wallets with the largest P&L and bot profit goes from $133 million to $40 million. ROI goes from +0.56% to +0.17%. Accuracy stays 49.9%. Those ten are (133 − 40) / 133 = 70% of bot profit, and about a third of bot wallets are profitable on their own. The type labels never see P&L. A k-means split into five groups, on log volume, log trades, the Herfindahl, buy ratio, and log active span, still isolates one profitable cluster at 49.8% accuracy and +0.27% ROI, with the most accurate clusters at 52.6% accuracy and −1.39% ROI.
The old article "Crowd Wisdom or Informed Minority? The 3% Who Carry Polymarket" counts a skilled account only after market makers are removed: at least 100 markets, at least 70% of volume from limit orders, and both sides in at least 70% of the markets traded. That screen is 1,660 accounts. The dollars here sit in the wallets that screen sets aside, at a coin-flip hit rate, paid for the entry. Their skilled share is 3.16% of accounts. Bots here are 73,615 wallets, 3.8% of 1.95 million, and 76.8% of volume. Different cut. The old article's market makers lean against the settlement and live on the spread, which is the same shape as a bot maker book: negative direction, positive execution.
Put the fee back into the execution leg
Score a buy against the previous trade. Direction, once the contract has settled, is the outcome minus that trade. Execution is that trade minus your fill. The fee comes off the execution leg. Before settlement the live number is the execution leg plus the fee. The forecast leg waits. Build the reference from your own earlier clips and you will measure a tradeoff this tape does not have.
Then compute excess accuracy, and size only if it is positive. The old article "Kelly Rejects Bad Trades Automatically: Why Overbetting Kills and Underbetting Doesn't" turns a negative edge into a trade you do not put on. Every type in Della Vedova's Table 2, Panel B, has negative excess accuracy. A 51.3% hit rate is that refusal.
Kappa is zero on Polymarket, and your broker's fee is not. The bot book's trade-weighted total edge is 0.2 cents a token. A 1 cent fee is five times that per-trade mean. It is not five times the $133 million, because the dollars are a different weighting, concentrated in wallets the per-trade mean does not describe. Gas on Polygon is outside his kappa. It sits on the wallet, in the same execution leg.
The bot dollars sit in the maker role, and retail still trails inside both roles. Bot makers earn +3.171 cents of execution and give back 2.879 cents on direction. Those add to the printed net of +0.292 cents. Bot takers pay 3.967 cents of execution and pick up 3.986 cents on direction. The components add to +0.019 cents, and the printed taker net is +0.018. A thousandth of a cent, in the source. Makers are 202.0 million of the 356.1 million bot trades in that role table, 202.0 / 356.1 = 56.7%, which he rounds to 57%. The performance table's bot count is 356.6 million. Half a million trades separate the two printed counts. Active retail trails inside both roles: maker totals −0.383 minus +0.292 = −0.675 cents, taker totals −0.710 minus +0.018 = −0.728 cents, which he rounds to 0.68 and 0.73. Directional bots, maker share under the bot median of 39%, lose money as a group. The early maker book is the aggregate. A late quote is a different trade.
His partial-equilibrium line gives active retail the bot-median execution edge, sides fixed, and the $79 million loss falls to about $23 million. The median is not in the tables, so the $23 million stays his number. The sentence also holds bot prices fixed. The book is zero-sum. Retail receives that entry only if the bot stops receiving it.
The coin-flip result stops at a one-dollar binary. On 14.1 million CBOE equity option contracts the two skills still fail to predict each other across a split sample, and sorting by accuracy pays: top quintile minus bottom quintile is +140.8 cents of total edge a share, which he also rounds to 141. The option adds a strike and an expiry, and a winner is not capped at one dollar. Ten points of accuracy keep a dollar value after the premium has moved. Here they run into one dollar minus the entry.
Wash volume, on the order of a quarter of shares and piled at prices near zero, makes about zero P&L, so it does not mint the $133 million. Splitting one desk across wallets adds noise and leaves the type-level dollars where they were. The off-chain matcher is not in the public record. A browser session that arrives after an API session is the same timing rent.
I am against sizing a prediction-market forecast on the hit rate. Score the previous trade. If excess accuracy is negative, the Kelly rule in that old article already has you flat. The object that repeats, once the benchmark is clean, is the entry.
KEY POINTS
- Split every buy into a directional rent, the payoff on your side minus the fair price, and an execution rent, the fair price minus the fill. At a 50 cent fair price, 60% accuracy at 65 cents loses $5 on 100 contracts, and 50% accuracy at 40 cents makes $10.
- Subtract the favorite's hit rate, the max of the price and one minus the price, before you treat a hit rate as a forecast. Active retail's chosen-side excess accuracy is −0.008.
- Grade the fill on the previous trade. The pooled slope of execution on direction is −0.178 under a backward VWAP of your own past fills and 0.000 under the lagged price.
- A ten-point accuracy gain is worth 0.10 times (1.162 minus 2.244 times the distance from 50 cents): 11.6 cents at a 50 cent price, 1.5 cents at 95 cents.
- On 222 million resolved Polymarket trades, bots at 49.9% accuracy earn $133 million and active retail at 51.3% lose $79 million. Lagged-price execution persistence is 0.434, accuracy persistence is 0.270, and the cross-skill slope is 0.000.
References
- Crowd Wisdom or Informed Minority? The 3% Who Carry Polymarket
- Bayesian Edge in Log-Odds: Better, Earlier, Calibrated — or It's Noise
- Kelly Rejects Bad Trades Automatically: Why Overbetting Kills and Underbetting Doesn't
- Who Profits from Prediction?
A note on AI. The ideas, research, analysis, and conclusions in this article are my own. I use AI tools to help with editing and wordsmithing, because English is not my first language, and I am not shy about that. AI-generated ideas and AI-assisted writing are not the same thing: the first is empty slop from a generic prompt, the second is a tool for communicating years of real research more clearly. Judge the work by its substance, not by whether software helped polish the prose.