5.11 How to Use Order Book Density for Better Limit Orders
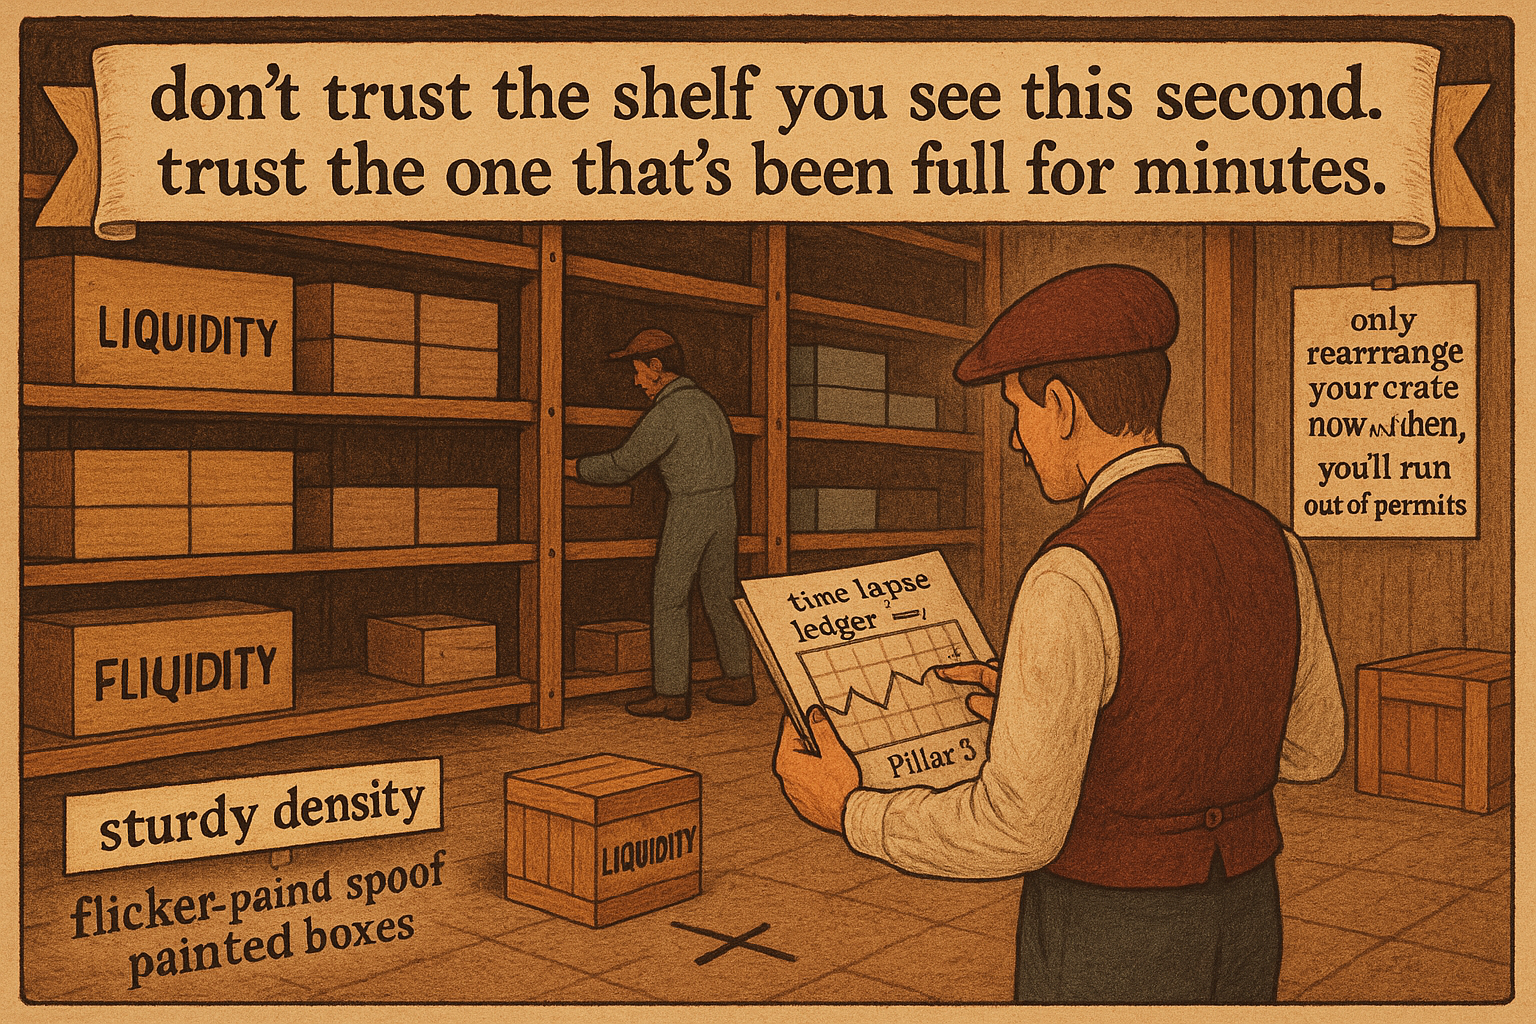
The book is a landscape of walls and gaps. Average density over minutes and place in front of shelves that stay stocked, weighing the edge of sitting behind size against the aggression to reach it.
The order book is not a flat ladder where every price level holds the same liquidity. It is a landscape of dense walls and thin gaps, and where you rest a limit order relative to that landscape changes both how fast you fill and how toxic the fill is. The previous article, "Order Placement Alpha: The Forgotten Edge", argued that placement is its own source of edge. This one builds the density analysis that drives the placement decision.
The core move is to stop looking at the book as a snapshot and start looking at it as an average over time, then place where that average tells you liquidity reliably sits.
Average density, not a snapshot
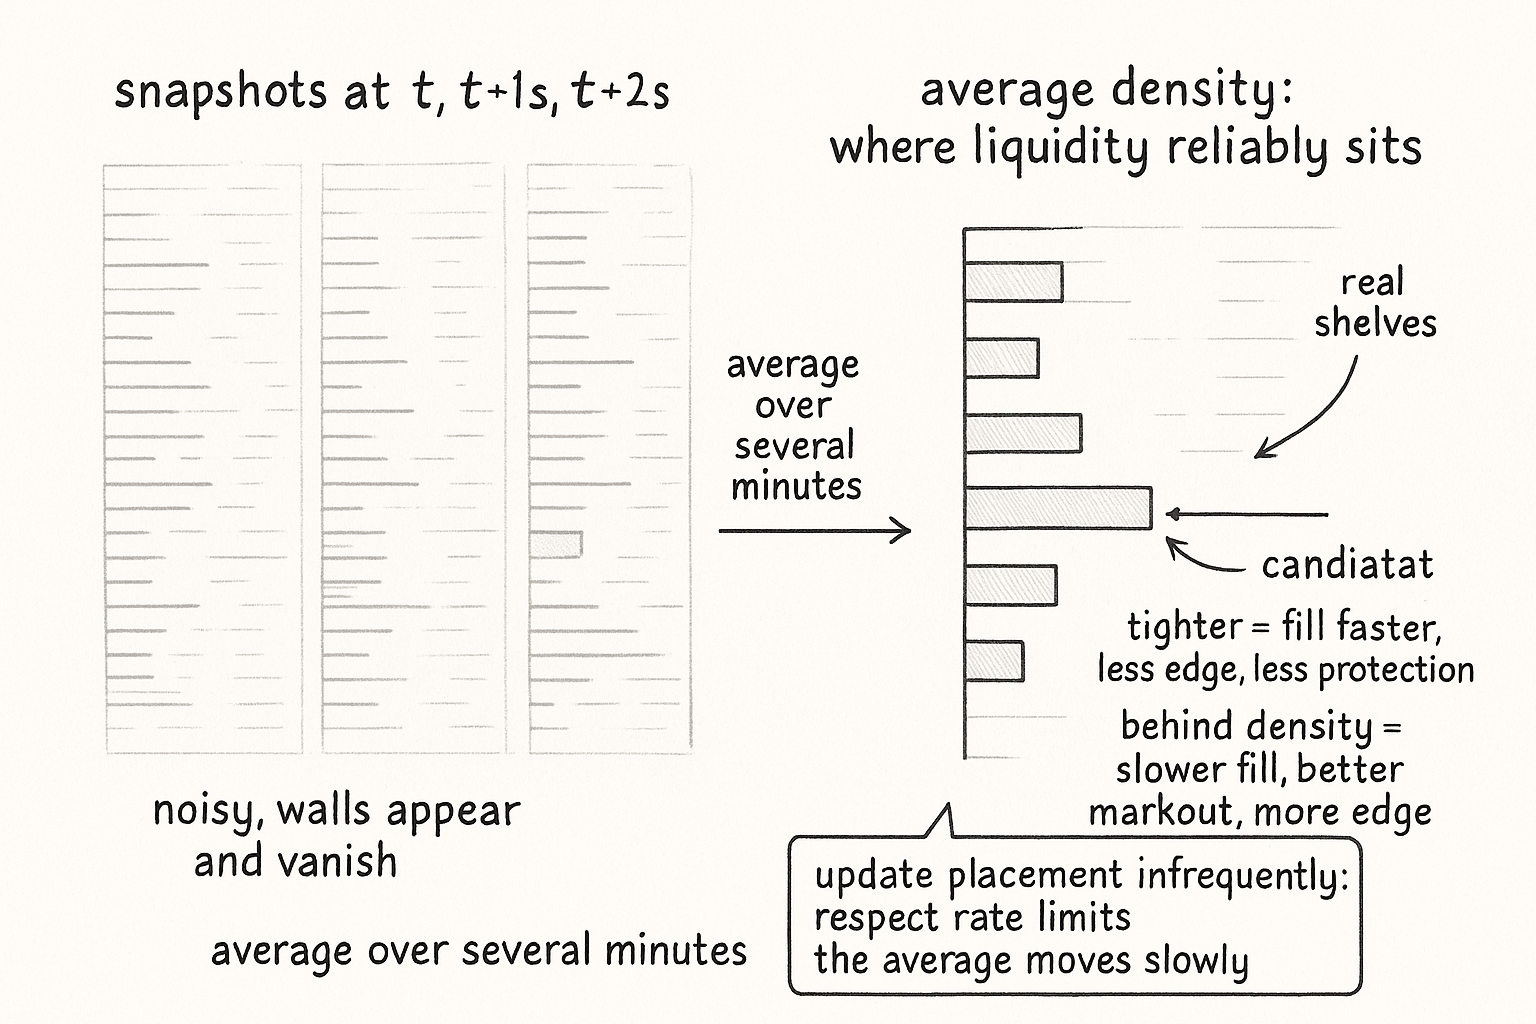
A single book snapshot lies to you. Orders flicker in and out on millisecond timescales, layered and pulled by other participants and by spoofers, so the wall you see this instant may be gone before you can use it. Take the average density over the course of multiple minutes instead, and the picture stabilizes into where liquidity actually rests rather than where it momentarily appears.
The average density at each price level near your target neighborhood is the input. A level that holds size consistently across minutes is a real shelf you can lean on; a level that shows size only in flickers is noise you should ignore. Build the average, find the optimal spot to place within your target neighborhood, and place there.
The size-versus-tightness trade-off
Placement is an optimization between two competing pulls. Place tighter, closer to the touch, and you fill faster but earn less edge per fill and sit in front of less protective size. Place behind a chunk of density, further from the touch, and you fill slower but with better markouts and more edge. The optimal placement balances the two.
The mechanism for the trade-off is explicit. You weight the benefit of skipping in front of a large chunk of density against the cost of the increased aggression that skipping requires, and the optimal density to place against falls out of that weighting. Skipping past a dense level to get in front of it costs you a more aggressive price; the question is whether the markout improvement and edge from sitting in front of that wall justify the aggression. Assign weights to that trade-off and the placement is decided by the numbers rather than by feel.
$$ \text{score}(p) = \text{edge}(p) + w \cdot \text{protective density behind } p - c \cdot \text{aggression}(p) $$
The score of placing at price p combines the edge you earn there, the protective resting density sitting behind that placement (weighted by w), minus the aggression cost of getting there (weighted by c). Place at the p that maximizes the score. The protective-density term is the markout benefit from "Order Placement Alpha: The Forgotten Edge": size behind you blocks takers from running the price through your fill.
Respect the rate limit
For large-scale quoting the analysis collides with exchange rate limits. Continuously one-upping other participants, shifting your order a tick every time someone else does, burns your order-update budget and gains little. So you match these placement modifications infrequently. Apply the density-driven adjustment at a measured cadence rather than chasing every change in the book, because the average density you are placing against moves slowly anyway, and reacting to every flicker spends your update budget on noise.
This is the practical reason the average-over-minutes view is not just cleaner but necessary: you cannot afford to re-place on every snapshot, so you place against the slow-moving average and update only when it has meaningfully shifted.
The sturdiness caveat
Density analysis assumes the density is real. The whole edge of placing in front of a large order depends on that order being there when you need it, and in crypto much of the visible size is spoofed and will vanish. Average density over minutes partly defends against this, since a persistent shelf is less likely to be a single spoof than an instantaneous wall is. But it is not a full defense, and density-based placement still needs the sturdiness logic from "Spoofing, Sturdy Liquidity, and Book Pressure" to avoid leaning on size that evaporates the moment it would have protected you.
Visualizing density
KEY POINTS
- The order book is a landscape of dense walls and thin gaps, not a flat ladder. Where you rest relative to that landscape changes both fill speed and fill toxicity.
- A single snapshot lies because orders flicker in and out. Average density over several minutes to see where liquidity reliably sits, then place within your target neighborhood against that average.
- Placement is a trade-off: tighter fills faster with less edge and less protection; behind a density chunk fills slower with better markouts and more edge.
- Decide it by weighting the benefit of getting in front of a large density chunk against the aggression cost of skipping to it. Score each placement and pick the maximum.
- The protective-density term is the markout benefit: size behind you blocks takers from running the price through your fill.
- Large-scale quoting hits exchange rate limits, so apply placement modifications infrequently at a measured cadence rather than one-upping every tick. The average density moves slowly, so this loses little.
- Density analysis assumes the size is real. Averaging over minutes partly filters spoofs, but density-based placement still needs explicit sturdiness logic to avoid leaning on liquidity that evaporates.
References
- The Art of Currency Trading - Brent Donnelly (Amazon)
- Market making under a weakly consistent limit order book model
- Optimal High-Frequency Trading in a Pro-Rata Microstructure with Predictive Information
- Optimal Limit Order Execution in a Simple Model for Market Microstructure
- Short-Horizon Excess Returns in Liquid Equities
- Deep Limit Order Book Forecasting A microstructural guide - arXiv
- What Happens When Institutional Liquidity Enters Prediction Markets
- The Cost of Latency in High-Frequency Trading
- Order Book Filtration and Directional Signal Extraction at ... - arXiv
- Limit Order Strategic Placement with Adverse Selection Risk
- Deep Reinforcement Learning for the Optimal Placement of Cryptocurrency Limit Orders
- Optimal Limit Order Choice
- Limit Order Books
- Liquidity Supply and Adverse Selection in a Pure Limit Order Book Market
- Limit Order Book Shape and Return Distribution
- Market Liquidity and Convexity of Order-Book
- Policy Gradient Methods for Optimal Trade Execution in Limit Order Markets
A note on AI. The ideas, research, analysis, and conclusions in this article are my own. I use AI tools to help with editing and wordsmithing, because English is not my first language, and I am not shy about that. AI-generated ideas and AI-assisted writing are not the same thing: the first is empty slop from a generic prompt, the second is a tool for communicating years of real research more clearly. Judge the work by its substance, not by whether software helped polish the prose.