10.7 Global vs Regional: When Complexity Wants More Data
Regional models beat global, said 20 years of linear studies. Redone with neural nets across 24 markets, it flips: complex models want global data. The global NN hits 0.74%/mo, t=5.73.
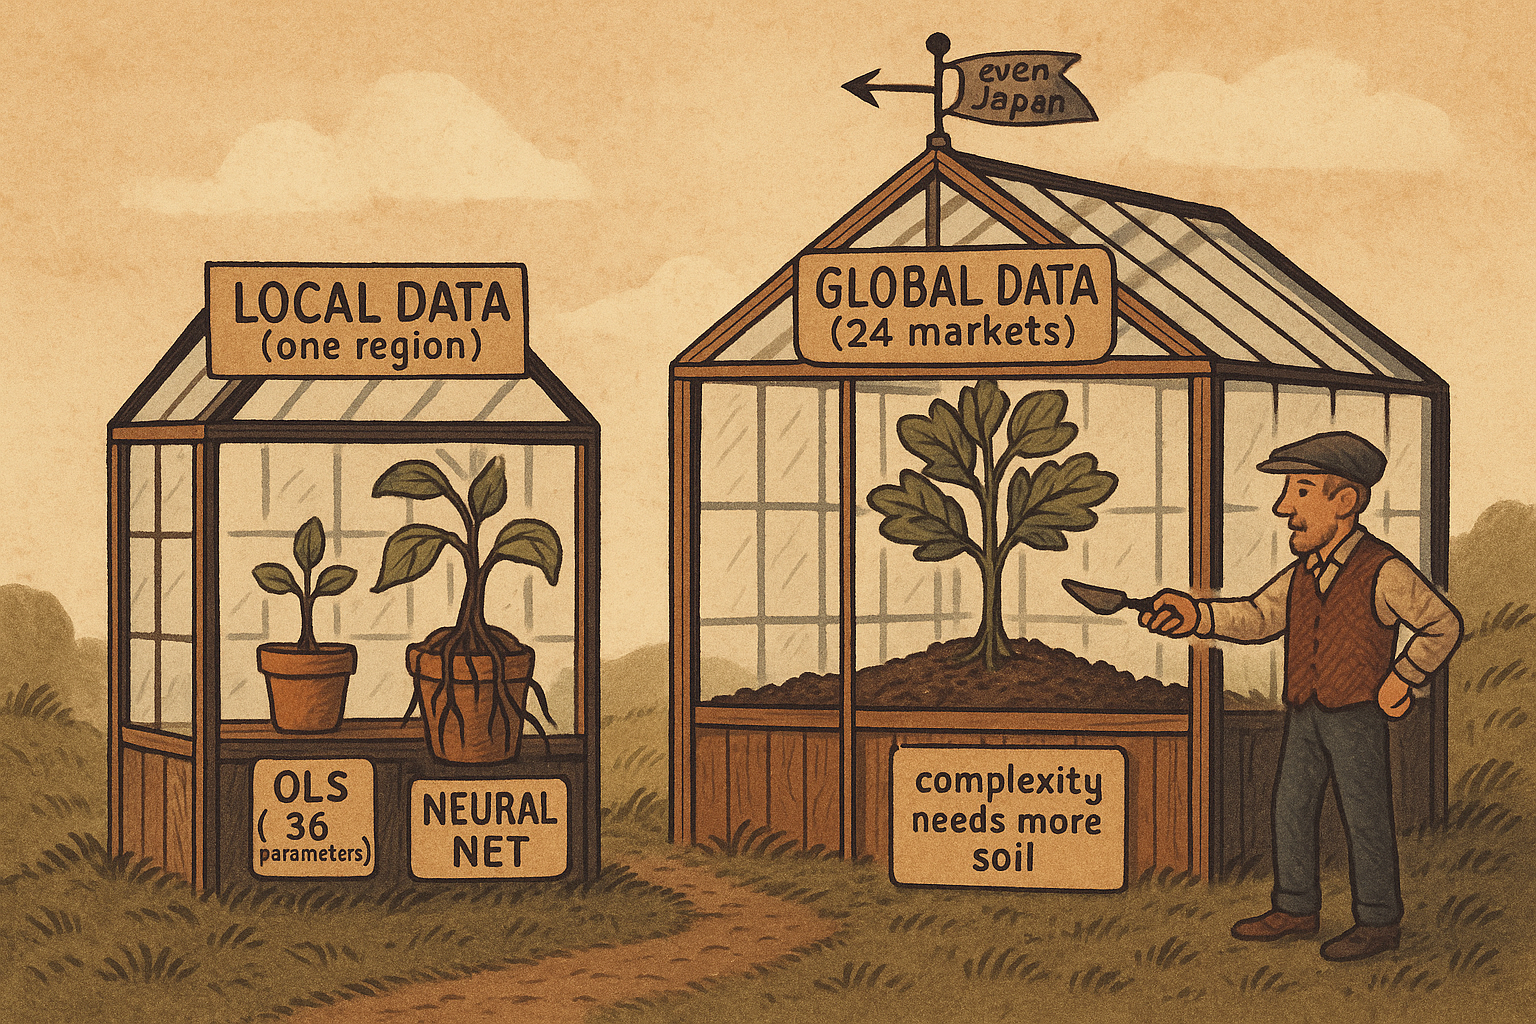
For twenty years the international asset-pricing literature had a settled answer: regional beats global. Griffin showed Fama-French factors work better country by country than pooled. Fama and French themselves found local four-factor models explain international returns better than global ones. Hollstein agreed. The story was that markets are not fully integrated, momentum is weak in Japan, value behaves differently in Europe, so you should train a separate model for each region and let it learn the local quirks.
That answer has a hole in it. Every one of those studies was ex-post and linear. Ex-post means they looked back and noticed that momentum was weak in Japan, which is not the same as a model predicting Japanese returns out of sample. Linear means they never asked what happens when the model is a gradient-boosted tree or a neural network instead of a regression. Chen, Hanauer, and Kalsbach redo the whole comparison the honest way, ex-ante across 24 developed markets with five algorithms, and the settled answer flips depending on one thing: model complexity. Simple linear models still slightly prefer local training. Complex models strongly prefer global. The old article "Does ML Actually Help Asset Pricing? Kelly's 20%, Not 2–3×" argued the nonlinear gain is real but modest. This is the sequel: that gain grows when you feed the complex model more data, and pooling the planet is how you feed it.
The setup: same 36 signals, two training geographies
The test is clean because only one thing changes. Twenty-four developed markets from July 1990 to December 2021, 36 firm characteristics, everything from book-to-market and momentum to Amihud illiquidity. Every characteristic is ranked cross-sectionally within each country and month onto the interval from minus one to plus one, so outliers cannot dominate, and missing values are set to zero. Microcaps are excluded, breakpoints come from big stocks, and portfolios are value-weighted long-short quintiles rebalanced monthly. Five algorithms run the gauntlet: OLS, elastic net, random forest, gradient-boosted regression trees, and a neural network ensemble.
Then the only lever: where the training data comes from. Regional training fits a separate model for each of North America, Europe, Japan, and Asia Pacific excluding Japan, then pools the forecasts. Global training fits one model on all markets at once. Same characteristics, same portfolios, same expanding-window discipline that never lets future data leak backward. The only question is whether learning is better done locally, where the patterns are region-specific, or globally, where there is far more data.
The headline: complexity flips the sign
The long-short portfolios get judged by the t-statistic of their mean monthly return.
$$ t = \frac{\bar{r}}{\operatorname{std}(r)/\sqrt{T}} $$
Read it as the average monthly spread return divided by its standard error, where the standard error is the return's standard deviation over the square root of the number of months. Work the winning model: the globally trained neural network earns 0.74% per month with a standard deviation of 1.99% over the 240 months from 2002 to 2021, so the t-stat is 0.74 divided by (1.99 over the square root of 240), which is 0.74 over 0.128, about 5.76, matching the paper's reported 5.73. Its local twin earns only 0.62% with a t of 4.62. For the linear models the ranking reverses: local OLS earns 0.47% against global OLS at 0.43%, and local elastic net beats global 0.43% to 0.39%. Simple models want to stay home; complex models want to travel.
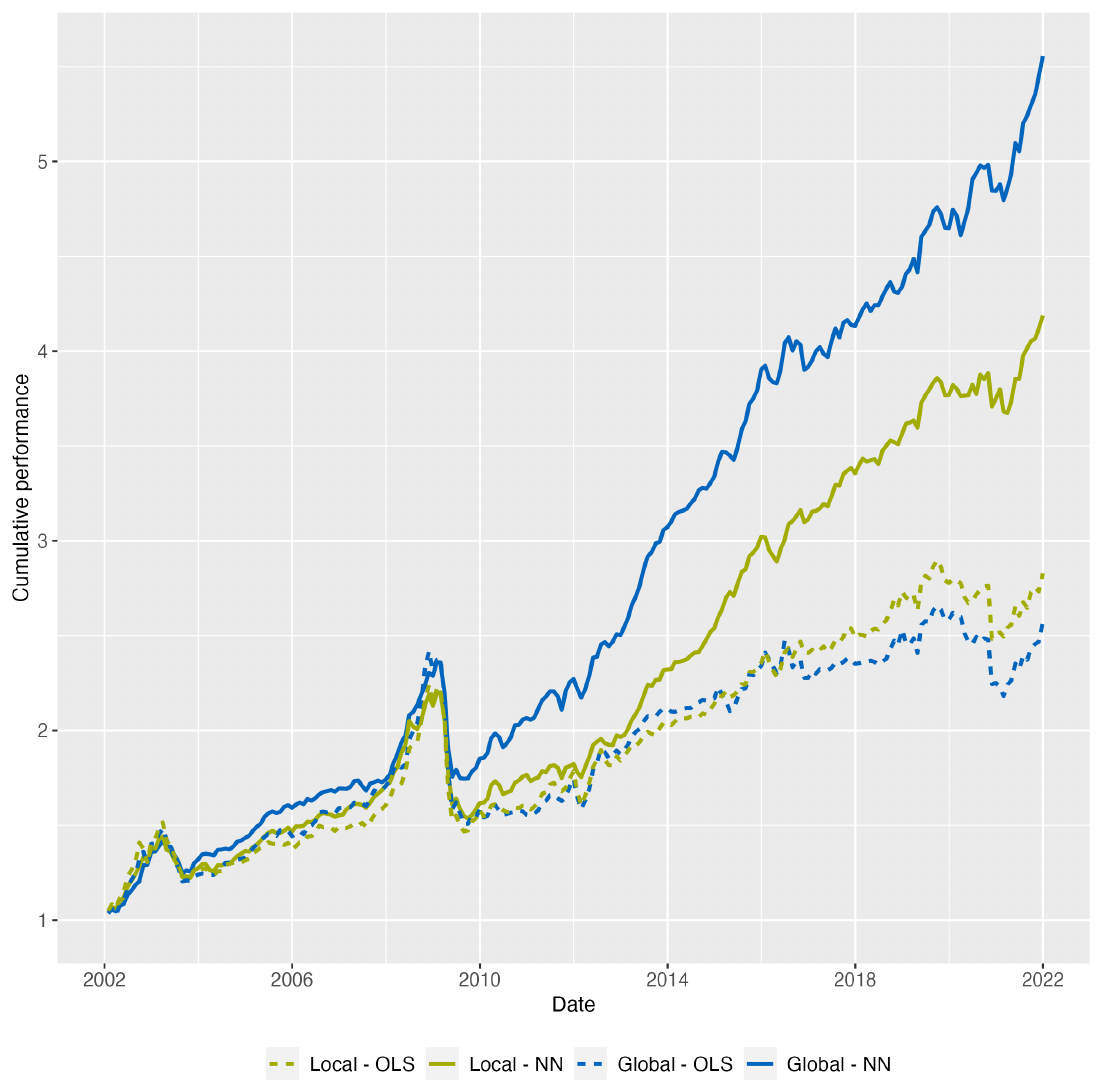
The cumulative curve makes the gap physical. Over the 20-year sample the globally trained neural network compounds to a 456% cumulative return, pulling away from the local neural network and leaving both OLS lines flat on the floor. The two linear models, local and global, are almost indistinguishable down there. All the action, and all the local-versus-global divergence, lives in the complex models.
Spanning tests: which one is redundant
Higher raw returns are not proof of added information, because the two models might just be repackaging the same signal. The spanning regression settles it. Regress one model's long-short return on the other's and look at the intercept.
$$ r^{\text{global}}_t = \alpha + \beta\, r^{\text{local}}_t + \varepsilon_t $$
The slope beta soaks up whatever the two portfolios share. The intercept alpha is the part of the global model's return that the local model cannot explain. A positive, significant alpha means global training delivers information local training misses. Run it both directions and the asymmetry is stark. Regress global on local and the neural network alpha is 0.20% per month with a t-stat of 3.45, and gradient-boosted trees give 0.15% with a t of 2.04, both significant. Reverse it, regress local on global, and the alphas are insignificant or negative, minus 0.07% for the neural network. Global spans local; local does not span global. The local model is the redundant one.
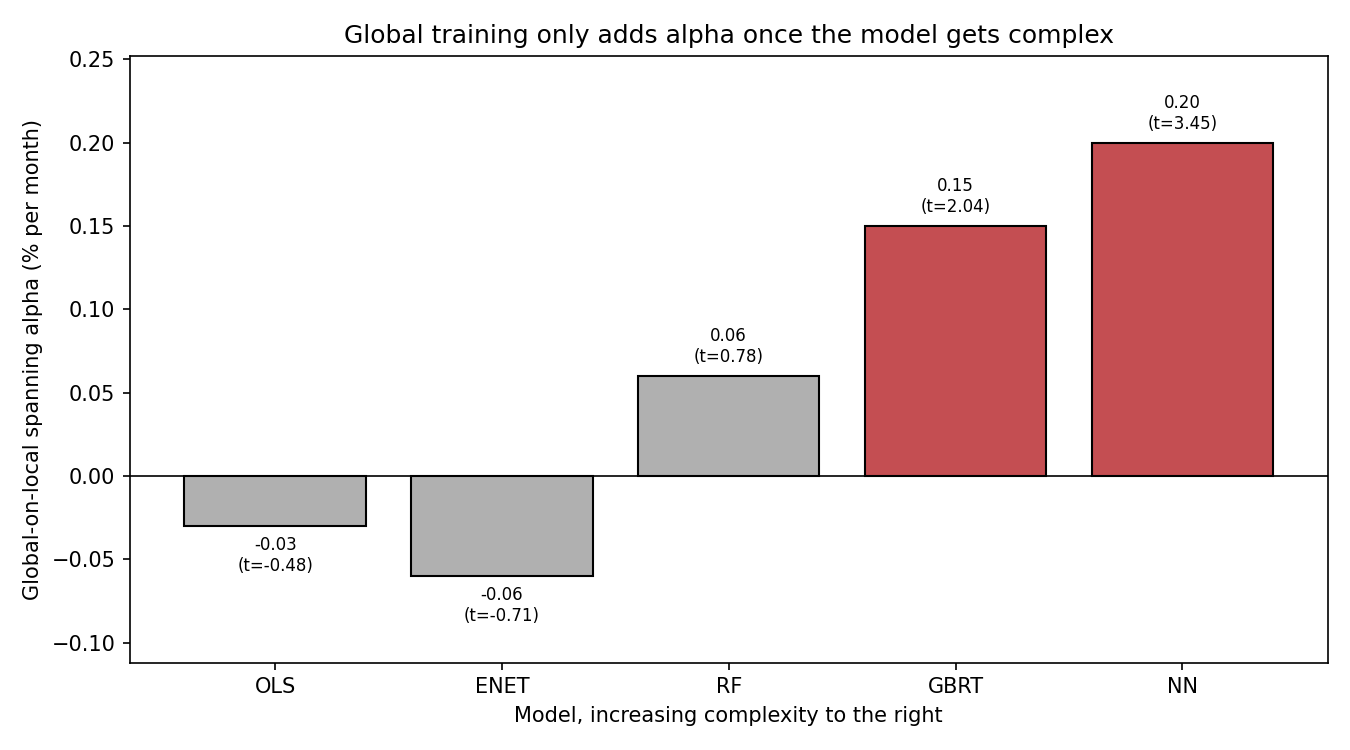
Line the alphas up by complexity and you see the sign flip directly. OLS and elastic net sit below zero and insignificant, meaning global adds nothing to linear models. Random forest is positive but weak. Only at the complex end, gradient-boosted trees and the neural network, does the global-on-local alpha turn significantly positive. Complexity is precisely the regime where global data earns its keep.
Why complexity is data-hungry
The mechanism is a counting argument, not magic. What matters for estimation is the ratio of observations to parameters.
$$ \text{observations-to-parameters} = \frac{N_{\text{stocks}} \times T_{\text{months}}}{P_{\text{parameters}}} $$
The more data points you have per parameter you must estimate, the more reliably you pin each parameter down. A linear model over 36 characteristics estimates 36 coefficients, and a single region has plenty of stock-months to nail 36 numbers, so pooling the world buys it almost nothing. The neural network is a different animal. Its deepest ensemble member runs 36 inputs into layers of 32, 16, 8, 4, and 2 neurons, which works out to roughly 1,900 weights to estimate (that count is approximate, from the architecture in the paper's appendix). Feed 1,900 parameters the stock-months of Japan alone and the model is starving, fitting noise. Feed it 24 pooled markets and the observations-to-parameters ratio jumps by whatever multiple the pooling provides, and the same architecture that overfit locally now estimates cleanly. Asset-pricing signal is faint and the process drifts, so complex models need every observation they can get, and geography is a cheap way to multiply observations without multiplying parameters. This is the same logic as the old article "The Difference Between Robustness and Optimization": more data pushes the estimate toward the robust plateau and away from region-specific noise the model would otherwise mistake for signal.
Even Japan bends
If any market should reward local training, it is Japan, the poster child for idiosyncratic behavior and dead momentum. It does not.
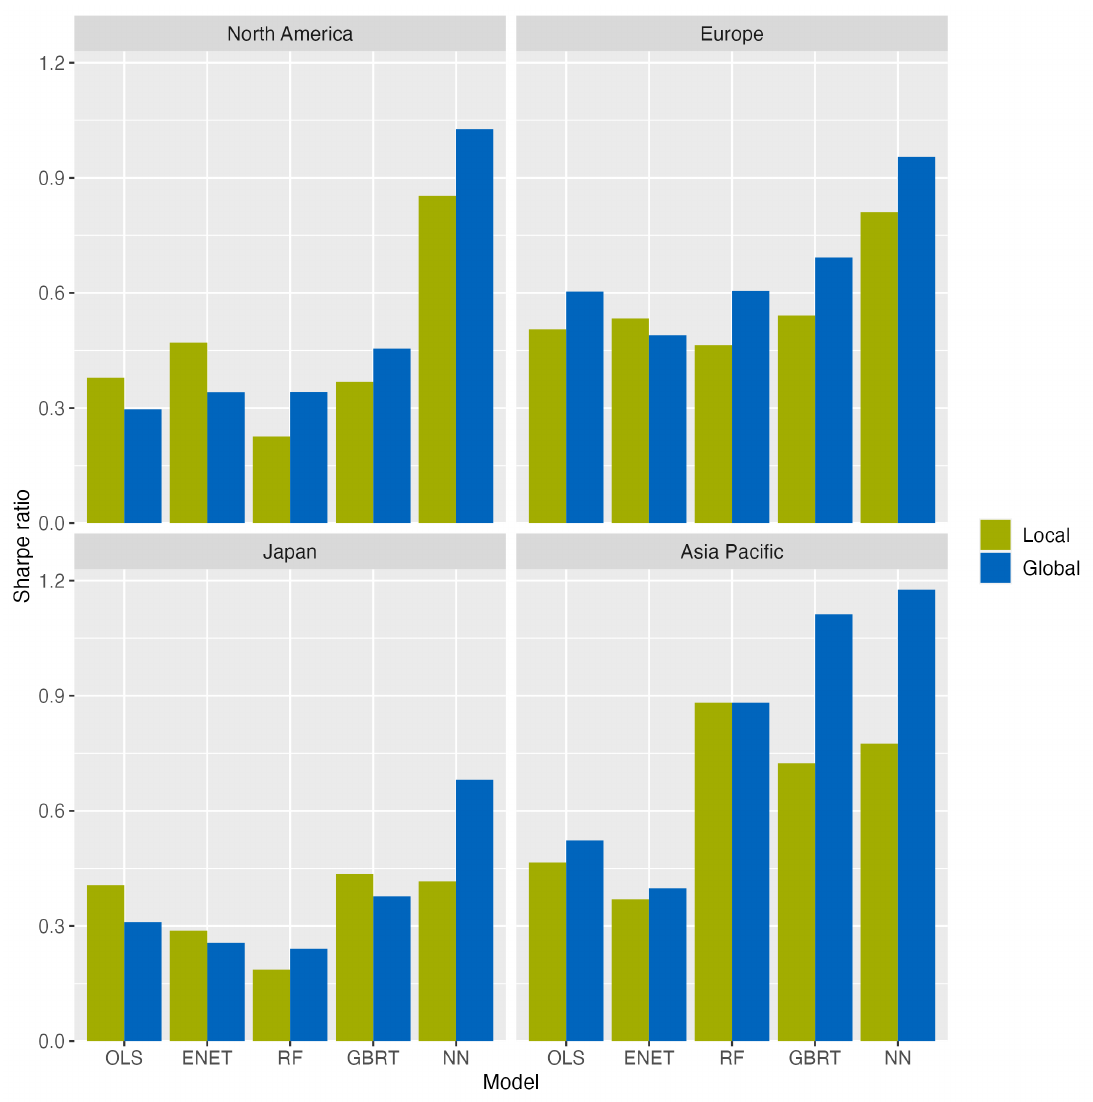
Split the results into four subregions and the globally trained neural network wins everywhere. North America: 1.03 global against 0.85 local. Europe: 0.96 against 0.81. Japan, supposedly the exception: 0.68 global against 0.42 local, the global edge actually wider here than elsewhere. Asia Pacific: 1.18 against 0.78. The region-specific-patterns story, the whole justification for local models, does not survive out of sample once the model is complex enough to use the global data. The linear models keep their split personality: global wins in Europe and Asia Pacific, local wins in North America and Japan, no consistent edge either way, which is exactly why the old linear literature could conclude that local wins and not be wrong on its own narrow terms.
Where this connects
This article extends the old article "Does ML Actually Help Asset Pricing? Kelly's 20%, Not 2–3×" by adding the missing variable. There the verdict was that nonlinear models beat linear ones by a modest margin. Here the margin turns out to be conditional: the complex model only delivers if you feed it enough data, and starving it on a single region throws the advantage away. It also sharpens the old article "The Difference Between Robustness and Optimization." Global training is a robustness move dressed as a data-scale move. Pooling 24 markets does not optimize to any region's quirks; it forces the model onto patterns that repeat across geographies, which is the definition of robustness by cross-market variation.
Two caveats keep this honest. The sample is developed markets from 2002 to 2021 and excludes microcaps by construction, so it sidesteps the tiny-illiquid-stock problem that haunted the machine-learning gains in the previous article. And the finding sits inside a live and unresolved fight over whether complexity is a virtue at all, with Kelly, Malamud, and Zhou arguing more parameters keep helping and Buncic arguing the effect is a mirage of how you scale the inputs. This paper is a data point for the pro-complexity side, not a verdict. The honest read is narrow and useful: if you are going to run a complex model, train it on as much of the world as you can.
KEY POINTS
- The old international-asset-pricing consensus, that regional models beat global, rested on ex-post, linear studies. Redone ex-ante with five algorithms across 24 developed markets, the answer flips with model complexity.
- Linear models slightly prefer local training (local OLS 0.47% per month versus global 0.43%). Complex models strongly prefer global: the global neural network earns 0.74% per month with a t of 5.73 versus 0.62% local, and compounds to a 456% cumulative return.
- Spanning tests break the tie. Global-on-local alpha is 0.20% (t of 3.45) for the neural network and 0.15% (t of 2.04) for boosted trees, both significant; local-on-global alphas are insignificant or negative. Global spans local, not the reverse.
- The mechanism is the observations-to-parameters ratio. A linear model estimates 36 coefficients and a single region suffices; a neural network with roughly 1,900 weights starves on one region and needs pooled global data to estimate cleanly.
- The result is robust across regions. The global neural network posts the highest Sharpe in all four subregions, including Japan (0.68 versus 0.42 local), killing the region-specific-patterns justification for local models.
- Global training is a robustness move: pooling markets forces the model onto patterns that repeat across geographies rather than fitting one region's noise.
- Caveats: developed markets only, microcaps excluded, 2002 to 2021, and the finding sits inside the unresolved virtue-of-complexity debate. The takeaway is conditional, not a law: if you run a complex model, feed it the whole world.
References
- Are the Fama and French Factors Global or Country Specific? (Griffin, 2002)
- Size, Value, and Momentum in International Stock Returns (Fama and French, 2012)
- Local, Regional, or Global Asset Pricing? (Hollstein, 2022)
- Empirical Asset Pricing via Machine Learning (Gu, Kelly, and Xiu, 2020)
- Characteristics Are Covariances: A Unified Model of Risk and Return (Kelly, Pruitt, and Su, 2019)
- The Virtue of Complexity in Return Prediction (Kelly, Malamud, and Zhou, 2024)
- Simplified: A Closer Look at the Virtue of Complexity in Return Prediction (Buncic, 2025)
- Replicating Anomalies (Hou, Xue, and Zhang, 2020)
- Model Complexity and the Performance of Global versus Regional Models (Chen, Hanauer, and Kalsbach, 2025)
A note on AI. The ideas, research, analysis, and conclusions in this article are my own. I use AI tools to help with editing and wordsmithing, because English is not my first language, and I am not shy about that. AI-generated ideas and AI-assisted writing are not the same thing: the first is empty slop from a generic prompt, the second is a tool for communicating years of real research more clearly. Judge the work by its substance, not by whether software helped polish the prose.