6.45 Don't Trust Your Strategy-Weighting Scheme
Scoring strategies four ways then averaging the weights isn't rigorous: the metrics collapse to two correlated families and every input is a noisy in-sample estimate. Beat equal-weight out of sample.

You hold five strategies and a fixed pool of capital, and you need a rule for splitting it. A tempting rule scores each strategy on a handful of metrics, converts each metric into a weight vector, then averages those vectors with a fixed blend like 0.3, 0.3, 0.2, 0.2. It reads as rigorous because it mixes return and risk, and it reads as safe because four numbers beat one. Both readings fail. The rule stacks several noisy in-sample estimates, secretly double-counts the same two quantities, and invites you to tune the blend until the backtest smiles. The old article "Why Portfolio Construction Is Part of the Signal" showed that how you weight changes what the book predicts, so a weighting rule this brittle is a second model riding on top of your strategies, and you never validated it.
The scheme, written out
Take four scores. Normalize each into a weight vector by dividing every strategy's score by the sum across strategies.
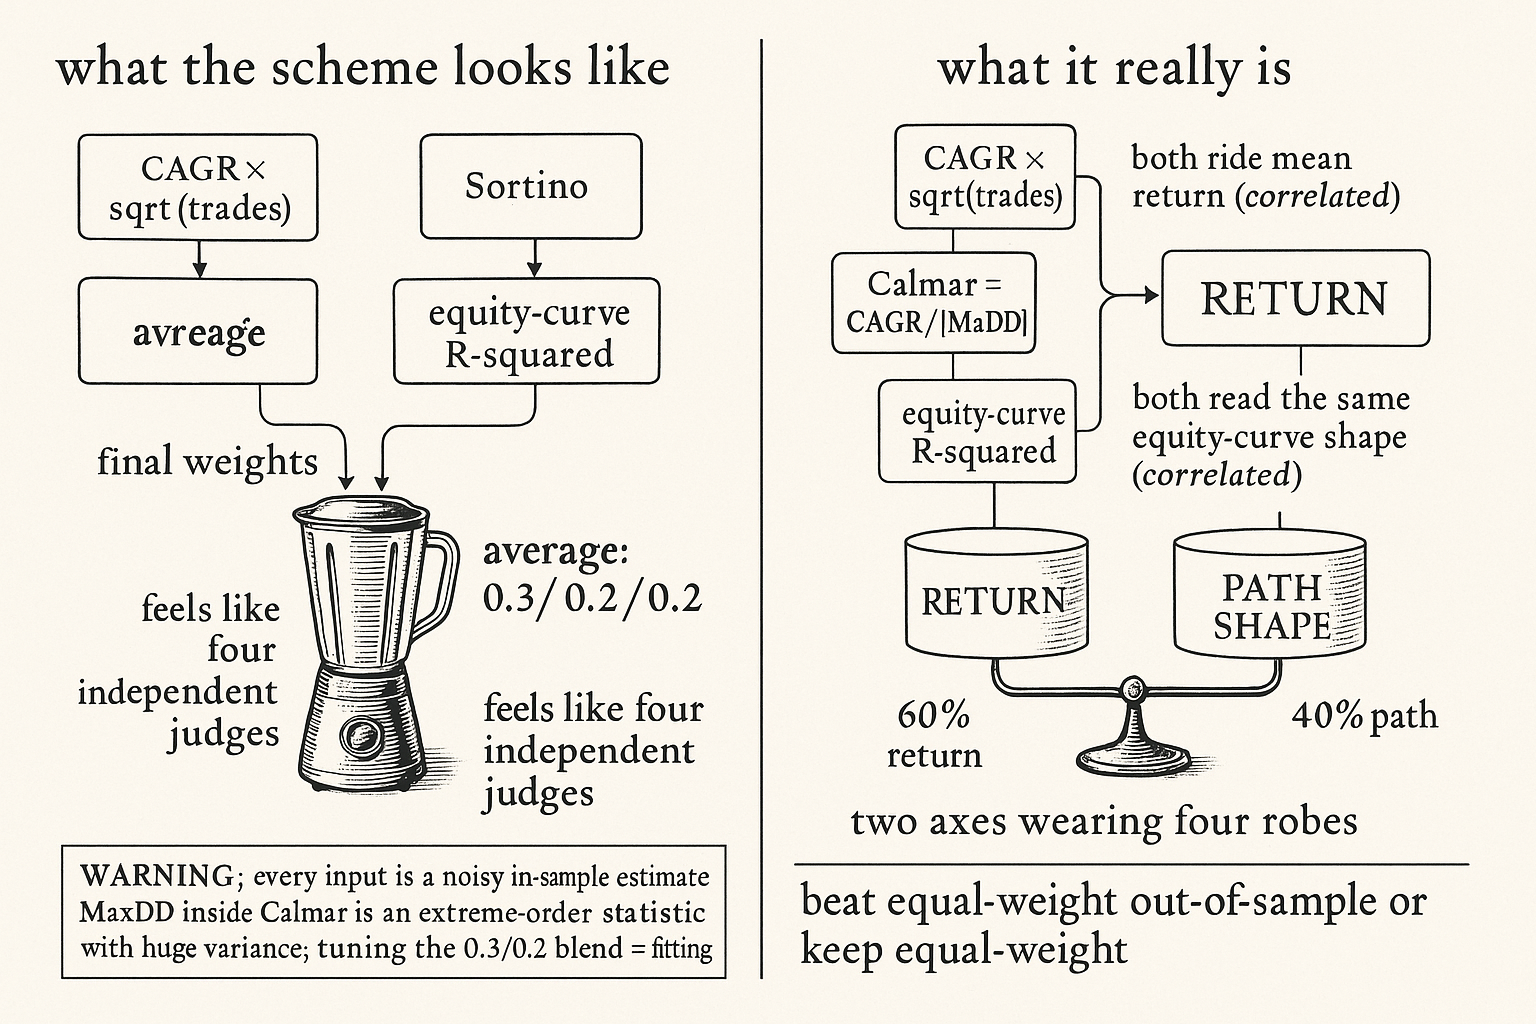
$$ \text{Return}_i = \text{CAGR}_i \cdot \sqrt{N_i}, \qquad \text{Sortino}_i = \frac{\text{CAGR}_i}{\sigma_{\text{down},i}} $$ $$ \text{Calmar}_i = \frac{\text{CAGR}_i}{|\text{MaxDD}_i|}, \qquad R^2_i = \text{fit of strategy } i\text{'s equity curve to a straight line} $$ $$ \text{FinalWeight}_i = 0.3\,\text{Return} + 0.3\,\text{Sortino} + 0.2\,\text{Calmar} + 0.2\,R^2 $$
Read it as: the first score rewards compounded growth, CAGR scaled by the square root of the trade count so a strategy with more trades earns more trust. The second rewards return per unit of downside deviation, Sortino. The third and fourth reward a clean ride: Calmar punishes the deepest pit relative to growth, and the equity-curve R-squared rewards a strategy whose cumulative P&L tracks a straight line instead of lurching. The final line averages the four normalized vectors with a 60 percent tilt to return and a 40 percent tilt to path quality. It looks like a balanced panel of four judges. It is three problems wearing one robe.
Pitfall one: every input is a noisy in-sample point estimate
CAGR, downside deviation, max drawdown, and equity-curve R-squared all come off one backtest, so all four are sample statistics with fat standard errors, not the true values. A sample CAGR is one realized path out of a distribution you cannot see, and a measured Sortino of 2.0 over a few hundred trades is consistent with a true Sortino near 0.5. Max drawdown is the worst case: it is an extreme-order statistic, the single deepest point on one path, so it carries enormous sampling variance and would land somewhere else on a fresh draw of the same process. The old article "Average Drawdown vs Extreme Drawdown" argued exactly this, that the worst point is the least stable number you can hang a decision on, and Calmar puts that number straight in the denominator.
The square-root-of-trades multiplier pretends to fix the reliability problem by trusting busier strategies more, but it conflates count with information. A few hundred tightly autocorrelated trades from one regime carry far less independent evidence than the raw count implies, so the multiplier inflates confidence in strategies that churned inside a single market state. You weight on numbers whose error bars overlap the gaps between them, and the rule treats them as exact.
Pitfall two: the four metrics are two metrics
Average four scores and you picture four independent views voting. They are not independent. They collapse into two families. CAGR-times-root-N and Sortino both ride mean return: a strategy with high compounded growth posts a high Sortino too, since Sortino is that same growth divided by a downside-deviation term that moves slowly across your strategy set. Calmar and equity-curve R-squared both read the shape of the cumulative P&L: a strategy whose equity climbs in a straight line has shallow drawdowns and a high R-squared, while a lumpy one digs a deep MaxDD and bends away from the line. Calmar carries a CAGR in its numerator, but across strategies its spread is dominated by the MaxDD denominator, so it tracks the path family, not the return family. Two correlated return metrics and two correlated path metrics.
So the 0.3, 0.3, 0.2, 0.2 blend is not a four-factor model. It is a 60 percent return, 40 percent path-quality weighting with two of the four columns adding the appearance of breadth and almost none of the substance. Averaging two near-copies of one quantity does not shrink its error, it doubles its vote, the same double-counting that poisons a feature set when you feed it two versions of one signal. If you wanted a 60/40 return-to-path tilt, you could write it in one line. The four-metric robe adds confidence without adding information.
Pitfall three: weighting the weights
The usual refinement, tune the 0.3/0.2 blend instead of leaving it flat, is the worst move on the board. The 60/40 split was already an arbitrary choice with no out-of-sample support. Optimize it and you convert a free constant into a fitted parameter, and fitting it on the same backtest that produced the scores means you are tuning the optimizer against in-sample noise. Every researcher degree of freedom you bolt onto a weighting rule is one more knob the backtest sets to flatter itself, and the bill arrives in live trading, where the tuned blend drifts like any other overfit parameter.
What to actually do
Reach for the rule that estimates the fewest inputs. Equal weight estimates nothing and is brutally hard to beat out of sample, which is why it is the honest baseline every fancier rule has to clear. Inverse-volatility or volatility-parity sizing estimates only a volatility, far more stable than CAGR or max drawdown, and it equalizes risk contribution directly, the thing the four-metric rule was groping toward. Go further and you go to correlation-aware construction from the old article "Why Portfolio Construction Is Part of the Signal," because the diversification gain lives in how correlated the strategies are, not in how many ways you scored their past returns. The deeper lesson runs through the old article "Portfolio of Systems Simulator" and the old article "The Death of the Single-System Trader": you survive on several genuinely uncorrelated systems, and no clever blend of correlated metrics manufactures independence the strategies lack. Validate any rule the one honest way, on out-of-sample performance against equal weight, and if it cannot clear equal weight after costs, keep the baseline.
Visualizing the collapse
KEY POINTS
- The four-score, average-the-weights scheme stacks four in-sample point estimates with fat standard errors; the max drawdown buried inside Calmar is an extreme-order statistic with the largest sampling variance of all, the weak foundation flagged by the old article "Average Drawdown vs Extreme Drawdown."
- The square-root-of-trades multiplier conflates trade count with independent information and over-trusts strategies that churned inside one regime.
- The four metrics collapse into two correlated families: CAGR-times-root-N and Sortino both ride mean return, Calmar and equity-curve R-squared both read the same path shape, so the blend is a 60/40 return-to-path tilt with two redundant columns faking breadth.
- Averaging two near-copies of one quantity doubles its vote without shrinking its error, the same double-counting trap that wrecks a redundant feature set.
- Weighting the weights turns an arbitrary blend into a fitted parameter optimized against the same in-sample noise, one more researcher degree of freedom the backtest will overfit.
- Prefer the rule with the fewest estimated inputs: equal weight as the baseline, then inverse-vol, then correlation-aware construction from the old article "Why Portfolio Construction Is Part of the Signal"; real diversification comes from uncorrelated systems, the lesson of the old article "Portfolio of Systems Simulator" and the old article "The Death of the Single-System Trader." Validate against equal-weight out of sample.
References
- Optimal Versus Naive Diversification: How Inefficient Is the 1/N Portfolio? (DeMiguel, Garlappi, Uppal)
- The Sharpe Ratio and Its Standard Error (Lo)
- Risk Parity and Inverse-Volatility Portfolio Construction
- The Calmar Ratio and Drawdown-Based Performance Measures
- Systematic Trading - Robert Carver (Amazon)
- Trading Systems - Urban Jaekle Emilio Tomasini (Amazon)
- Volatility Managed Portfolios
- The Impact of Volatility Targeting
- Tail Risk Targeting: Target VaR and CVaR Strategies
- Stock Portfolio Design and Backtest Overfitting
- Backtest Overfitting in the Machine Learning Era
- Volatility Scaling in Multi-Asset Portfolios
- Sustainable Investing and the Cross-Section of Returns and Maximum Drawdown
- A Momentum-Gated Hierarchical Optimisation Framework for Multi-Regime Equity Portfolios