9.42 Crowd Wisdom or Informed Minority? The 3% Who Carry Polymarket
Polymarket sign-randomization skill test: flip each account's bets one event at a time, and about 3% still beat the scramble. Their volume cuts pricing error; crowd volume raises it.
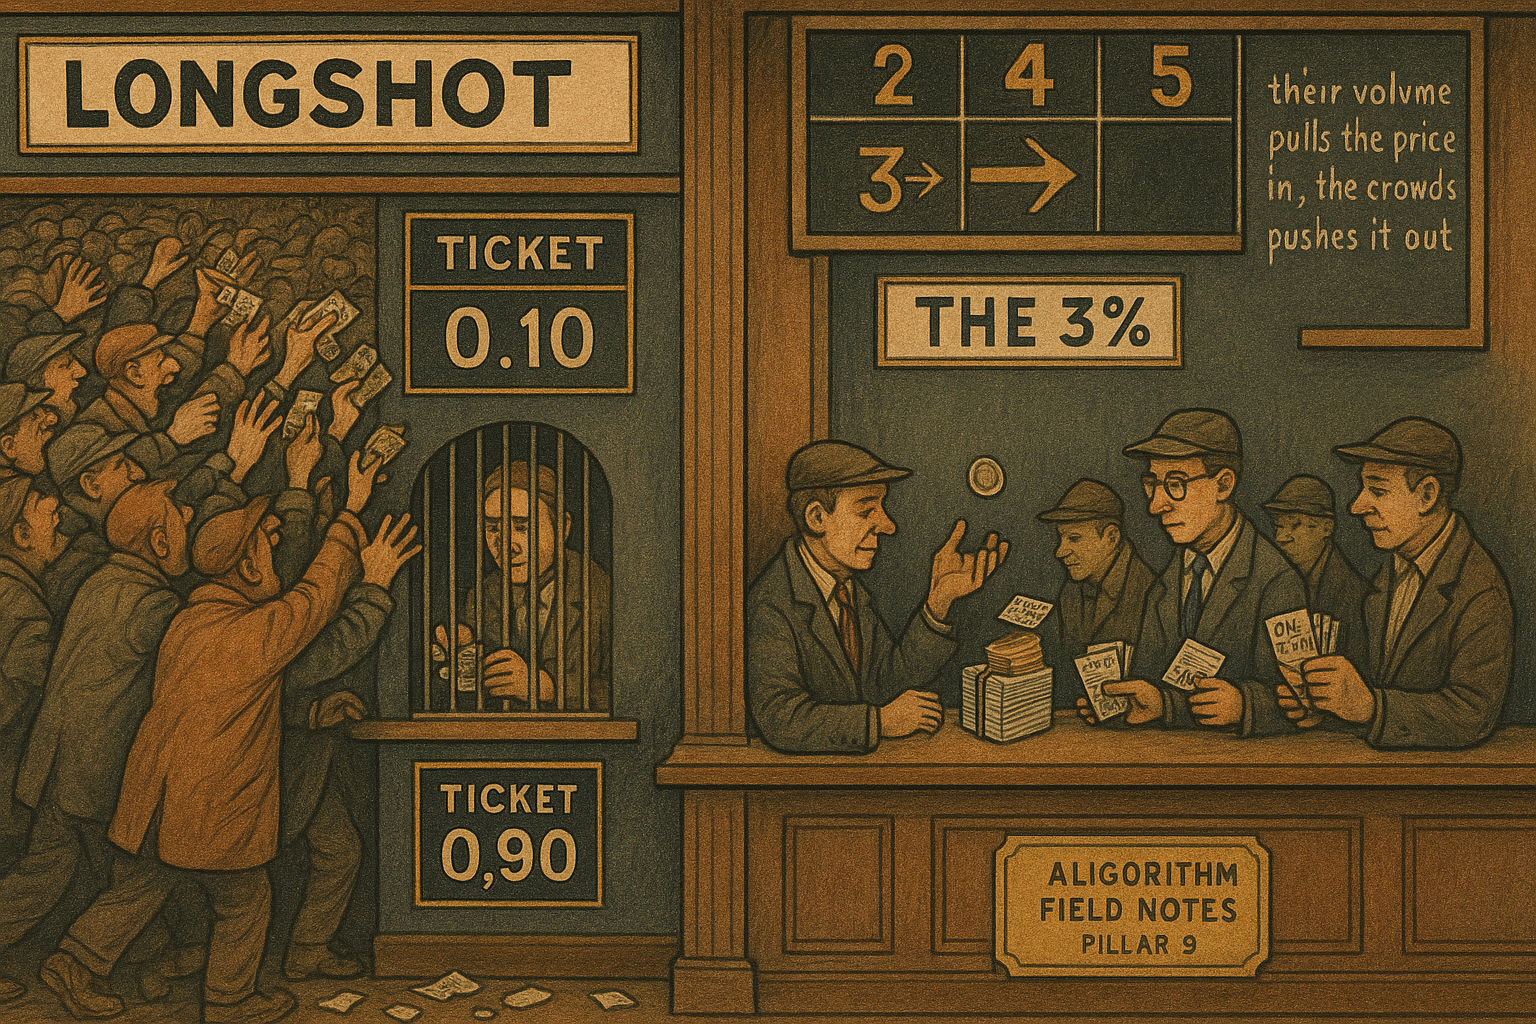
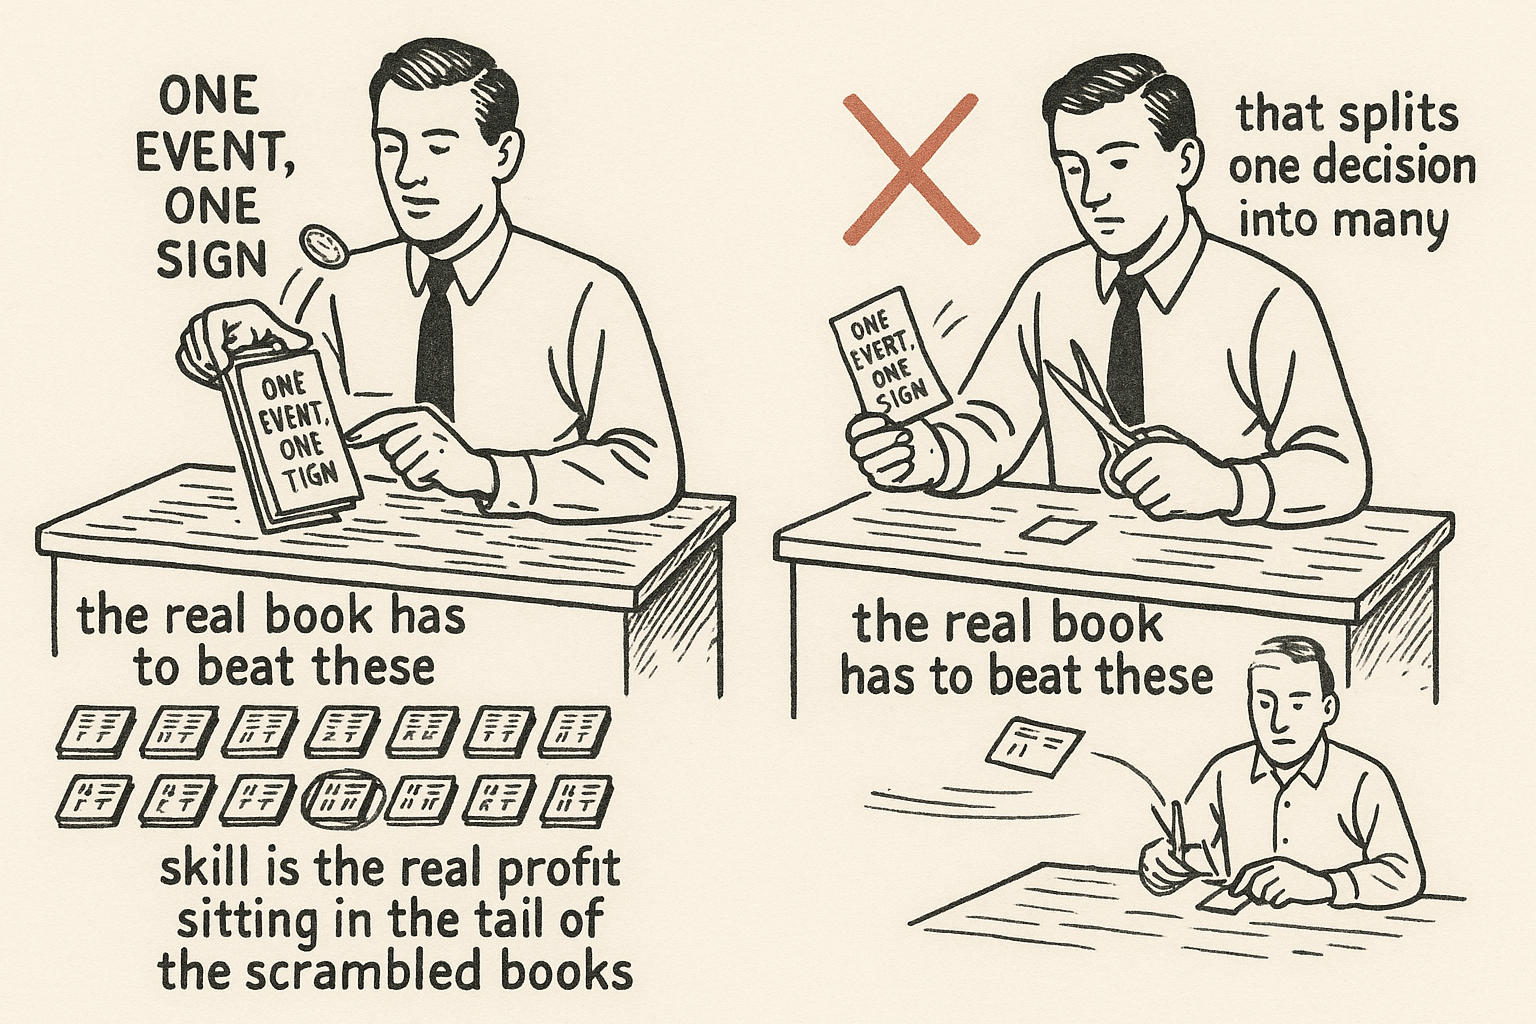
Gómez-Cram, Guo, Jensen, and Kung score a Polymarket account by scrambling its book. They keep every size, price, and outcome, and they flip the sign of the book one event at a time. The account is skilled only when the real profit still sits in the tail of those scrambled books. That cut holds 3.16% of the 1.72 million accounts on a $13.76 billion tape. The platforms keep describing the contract price as the crowd's pooled opinion. A price can sit close to the outcome and still be pushed there by a small book trading against everyone else.
A scrambled book is the null, and 3.16% of accounts beat it
The account's profit is the sum of signed gaps between the price it paid and the 0 or 1 the contract printed.
$$ \mathrm{PnL} = \sum_{e=1}^{E} \sum_{k \in e} q_k \, d_k \, (Y_k - p_k) $$
Each fill contributes shares times side times the settlement gap. The side d is +1 on a buy and −1 on a sell. Y is the contract's final 0 or 1, and p is the price of that fill. A buy of a contract that settles at 1 earns the gap under 1. A sell earns the gap when the price was above the settlement. One account, one event, two buys, settlement Yes. The first buy is 100 shares at 0.40, so the fill earns 100 times (1 − 0.40) = 60. The second buy is 50 shares at 0.55, so it earns 50 times (1 − 0.55) = 22.5. That event's contribution is 82.5. Flipping the two fills separately can turn the second buy into a sell and produce a book the account never held. The authors flip the whole event, both fills together.
The null book uses one sign per event.
$$ \mathrm{PnL}^{(b)} = \sum_{e=1}^{E} \varepsilon_e^{(b)} \sum_{k \in e} q_k \, d_k \, (Y_k - p_k) $$
Each simulated book b draws a sign ε of +1 or −1 for every event, with equal probability, and multiplies that event's whole contribution by the sign. Sizes, prices, and outcomes stay put. Give the same account three more events, with contributions +40, +25, and +10. Realized profit is 82.5 + 40 + 25 + 10 = 157.5. Flip only the first event and the simulated profit is −82.5 + 40 + 25 + 10 = −7.5. With four events the sign patterns number 16. The authors draw B = 1,000 of them. For a toy this small, enumerate all 16.
The p-value is the fraction of simulated books that beat the real one, with ties counted at half.
$$ p = \frac{\#\{\mathrm{PnL}^{(b)} > \mathrm{PnL}\} + \tfrac{1}{2}\,\#\{\mathrm{PnL}^{(b)} = \mathrm{PnL}\}}{B} $$
The half-count is there because the real sign pattern is always one of the simulated books, so a perfect account ties itself. Counting that tie in full pushes p up and hides skill. Half a tie also makes the test symmetric: the account that earned the opposite profit gets 1 minus p. On the four-event book every contribution is positive, so the only pattern that matches 157.5 is the real one, and none beat it. With all 16 patterns, p = (0 + 0.5 times 1) / 16 = 0.03125. The opposite book, profit −157.5, has 15 patterns above it and one tie, so p = 15.5 / 16 = 0.96875, which is 1 − 0.03125. The smallest p the test can return is 2 raised to −(E+1). Three events cannot get under 0.05, because 2 raised to −4 is 0.0625. Four events can, because 2 raised to −5 is 0.03125. A simulation that wanders outside that floor is noise, and the authors truncate back to it.
The benchmark they use for the rest of the paper is stricter than this toy. An account is skilled at p below 0.05, and only if it traded at least ten events. Between 0.05 and 0.95 the profit is luck: lucky when profit is positive, unlucky when it is negative. Above 0.95 the account is anti-skilled. Market makers are pulled out before any of that, by behavior: at least 100 markets, at least 70% of volume from limit orders, and both sides of the outcome in at least 70% of the markets they trade. That screen is 1,660 accounts, 0.10% of the tape. A liquidity provider with a small positive profit never enters the skill count.
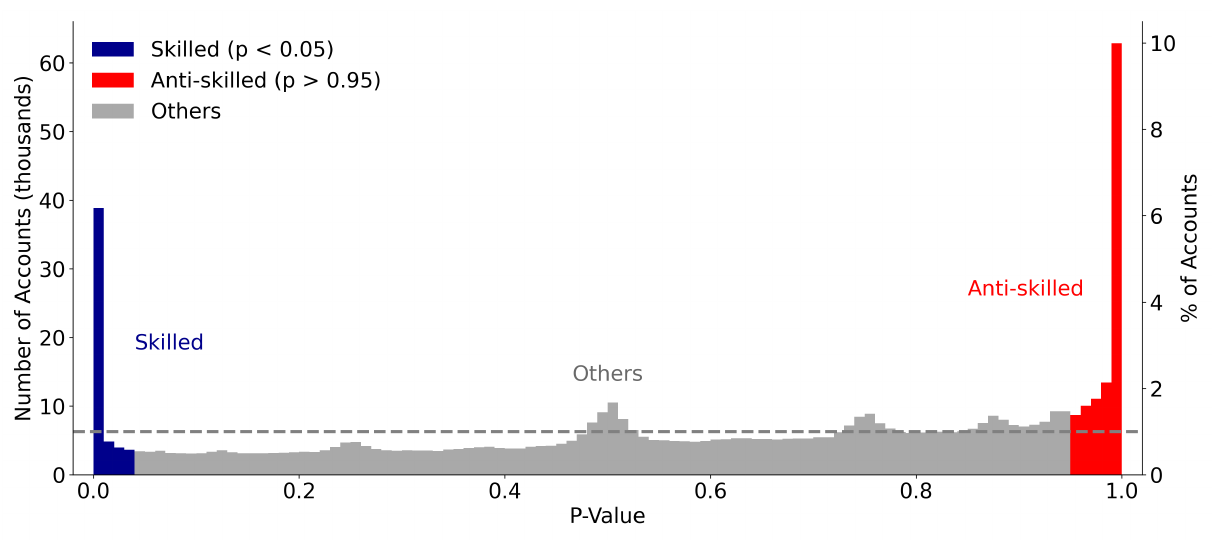
Look at the two spikes against the dashed line. The dashed line is the flat density you would get if no account had skill. The left spike is p below 0.05. The right spike is p above 0.95, and it is about twice as tall: 105,951 anti-skilled accounts against 54,325 skilled ones, a ratio of 1.95. The figure is only accounts with at least ten events. In that filtered set the skilled are 8.63% and the anti-skilled are 16.84%. Against every account on the tape the skilled are 54,325, which is 3.16%, and the anti-skilled are 6.15%. Lucky accounts are everyone with positive profit who does not clear p below 0.05. That is 28.93% of all accounts, and it includes short histories the test never scores as skilled. Unlucky accounts, negative profit and not anti-skilled, are 61.66%. Plenty of both groups are missing from the figure, because an account under ten events is outside the plotted set. The authors' crowd is the lucky, the unlucky, and the anti-skilled. Those three printed shares add to 96.74%, which they round to 96.7%.
Profit is a bad ranking. On a random split of events into a training set and a test set, the rank correlation of profits is 0.11 overall, and it is −0.12 among accounts that made money in the training set. Winners reverse. The correlation of the sign-randomization p-value is 0.35. In the transition matrix, 0.46 of training-set skilled accounts are skilled again in the test set, and 0.22 land in the lucky bin, so 0.68 are still profitable. The skilled row of that matrix sums to 0.99 on the printed entries, a rounding gap of 0.01. Of the training-set lucky, 0.61 become unlucky and 0.03 become anti-skilled, which is the authors' 64% who lose out of sample. The lucky row also sums to 0.99. Their concrete case is the account @majorexploiter, tagged lucky after betting $4.5 million on three sports matches in one weekend in early 2026 and winning $3.6 million. That is one event cluster, and the test set usually takes it away.
They run a cousin of the same split on active mutual funds, classifying a fund by whether a four-factor alpha (market, size, value, momentum) is significant. On that test, 10% of skilled funds stay skilled, and 6% of anti-skilled funds stay anti-skilled. The prediction-market rates are 46% and 48%. One test is a fund alpha. The other is an event-level sign flip. The gap is still large, and the comparison is the one they ran.
Breadth is the other half of the label. The skilled account trades 60.22 events and 78.35 markets on average, earns $3,243, and has $115,392 of volume. The lucky account trades 18.88 events and 22.75 markets, earns $914, and has $16,741 of volume. Profit concentration is the Herfindahl-Hirschman index of an account's profit across events, the sum of squared event shares. The skilled average is 0.24, so the reciprocal is 1 / 0.24 = 4.17 effective events. The lucky average is 0.64, and 1 / 0.64 = 1.56. The single best event is 34.58% of a skilled account's profits and 71.00% of a lucky account's. Divide the printed average profit by the printed average volume and the lucky look better: 913.61 / 16,741.48 = 5.46% of volume, against 3,243.42 / 115,391.76 = 2.81% for the skilled. That ratio promotes the one-weekend winner. Do not sort on it.
The dollar totals are a zero-sum check, up to the rounding of the table. Market makers, skilled, and lucky show gains of 19.58 + 176.20 + 455.10 = 650.88 million dollars. Unlucky and anti-skilled show losses of 531.82 + 119.09 = 650.91 million. The two sides differ by 0.03 million on the printed figures. The authors say the gains and losses offset. The residual is rounding, and the source may be off by that 0.03 in the last digit. The skilled take 27.07% of the gains. The lucky take 69.92%. More of the dollars sit with the group whose profits do not persist.
The volume column has a different trap. The five group volumes are 2.18, 6.27, 8.34, 9.17, and 1.56 billion, and they sum to 27.52 billion. That is exactly twice the $13.76 billion headline, so the column counts both sides of each trade. The shares still add to a weight of the tape: skilled 22.75%, and the crowd's three shares 30.27 + 33.30 + 5.66 = 69.23%, which the authors call about 70%. The printed volume shares themselves add to 99.91, short a tenth of a point from rounding.
A false-discovery cut changes the headcount. Under a pure null, about 5% of tested accounts clear p below 0.05 by chance. The Benjamini-Hochberg procedure, applied separately to each tail at a 5% false-discovery rate, leaves 33,522 skilled accounts, 1.95% of the tape, on the ten-event filter. Treat 3.16% as the unadjusted count. The appendix re-estimates the price-discovery slopes on that tighter group, and the skilled column keeps its sign.
The old article "What a Market Price Actually Is: Capital-Weighted Consensus and the Brier Skill Score Gate" is a different gate. That piece asks whether the price, a capital-weighted belief, is a calibrated probability. This test asks whether an account's dollars beat a scrambled book. A price can pass the calibration gate while 96.74% of accounts fail the sign test.
Order imbalance divides by the whole bin
Order imbalance is the group's buy shares minus its sell shares, over every share that changed hands in the bin.
$$ \mathrm{OIB}^{g}_{m,t} = \frac{B^{g}_{m,t} - S^{g}_{m,t}}{B_{m,t} + S_{m,t}} $$
The numerator is that group's Yes buys minus its Yes sells. The denominator is all buys plus all sells, every group. On a matched tape every buy is someone's sell, so total buys equal total sells, and the ratio runs from −0.5 to +0.5. The authors state that bound. It is the bound you get only if you keep both sides in the denominator. A bin where the skilled buy 400 shares and sell 100, while the whole market buys 1,000 and sells 1,000, has OIB = (400 − 100) / (1,000 + 1,000) = 0.15. If the skilled are the only buyer, they buy all 1,000 and sell none, and OIB = 1,000 / 2,000 = 0.5. Code the denominator as the group's own buys plus its own sells and that same case prints 1.0. The paper's only-buyer case is 0.5.
Each market's life is cut into 50 equal bins, so a two-day market and a two-month market share a clock. The median market lasts 2.36 days, so a bin is 2.36 / 50 times 24 hours = 1.13 hours. About 43% of volume sits in the last 5% of the life, which is 2.36 times 0.05 times 24 = 2.83 hours. The regressions use every bin.
The slope is a separate regression for each group, on the held-out events.
$$ y_{m,t} = a^{g} + b^{g} \,\mathrm{OIB}^{g}_{m,t} + \mathrm{controls}_{m,t-1} + e_{m,t} $$
The left-hand side is either the next bin's price change or the market's final 0 or 1. The controls are lagged price, lagged price change, lagged log volume, and market duration. Accounts are labeled on the training events. The fit is on the test events. With the controls held fixed, a rise of 0.10 in the ratio moves the fitted left-hand side by 0.10 times b. Standard errors are clustered by event and by month.
Accuracy is the change in distance to the print
A bin helped when the absolute distance from price to the final 0 or 1 got smaller.
$$ \mathrm{PD}_{m,t-1,t} = \left|p_{m,t} - Y_m\right| - \left|p_{m,t-1} - Y_m\right| $$
Subtract the previous absolute error from the current one. Negative means the price moved toward the print. Positive means it moved away. Start the bin at 0.42, end it at 0.61, and let the contract settle at 1. The end error is |0.61 − 1| = 0.39. The start error is |0.42 − 1| = 0.58. PD = 0.39 − 0.58 = −0.19. The price got 19 cents closer. Reverse the subtraction and you will call that improvement a deterioration. The paper's order is end minus start.
The group's trading in that same bin is an unsigned share.
$$ \mathrm{VOL}^{g}_{m,t} = \frac{B^{g}_{m,t} + S^{g}_{m,t}}{B_{m,t} + S_{m,t}} $$
Add the group's buys and sells, and divide by all buys and sells. The sign lives entirely in PD, so the share does not need one. In the bin above, skilled buys of 400 and sells of 100 on a tape of 2,000 two-sided shares give VOL = 500 / 2,000 = 0.25. A one-sided share of the 1,000 contracts that changed hands would be 0.50. Use the paper's denominator or you will double their coefficient when you try to read it.
$$ \mathrm{PD}_{m,t-1,t} = a^{g} + b^{g} \,\mathrm{VOL}^{g}_{m,t} + \mathrm{controls}_{m,t-1} + e_{m,t} $$
Same controls, same train-and-test split. With the controls held fixed, a volume share of 0.25 moves fitted PD by 0.25 times b. A negative b means that when this group is a larger fraction of the bin, the absolute error tends to shrink.
The skilled book is full of public trades
The insider objection is the obvious one, and the authors' answer is what these accounts do with public prices.
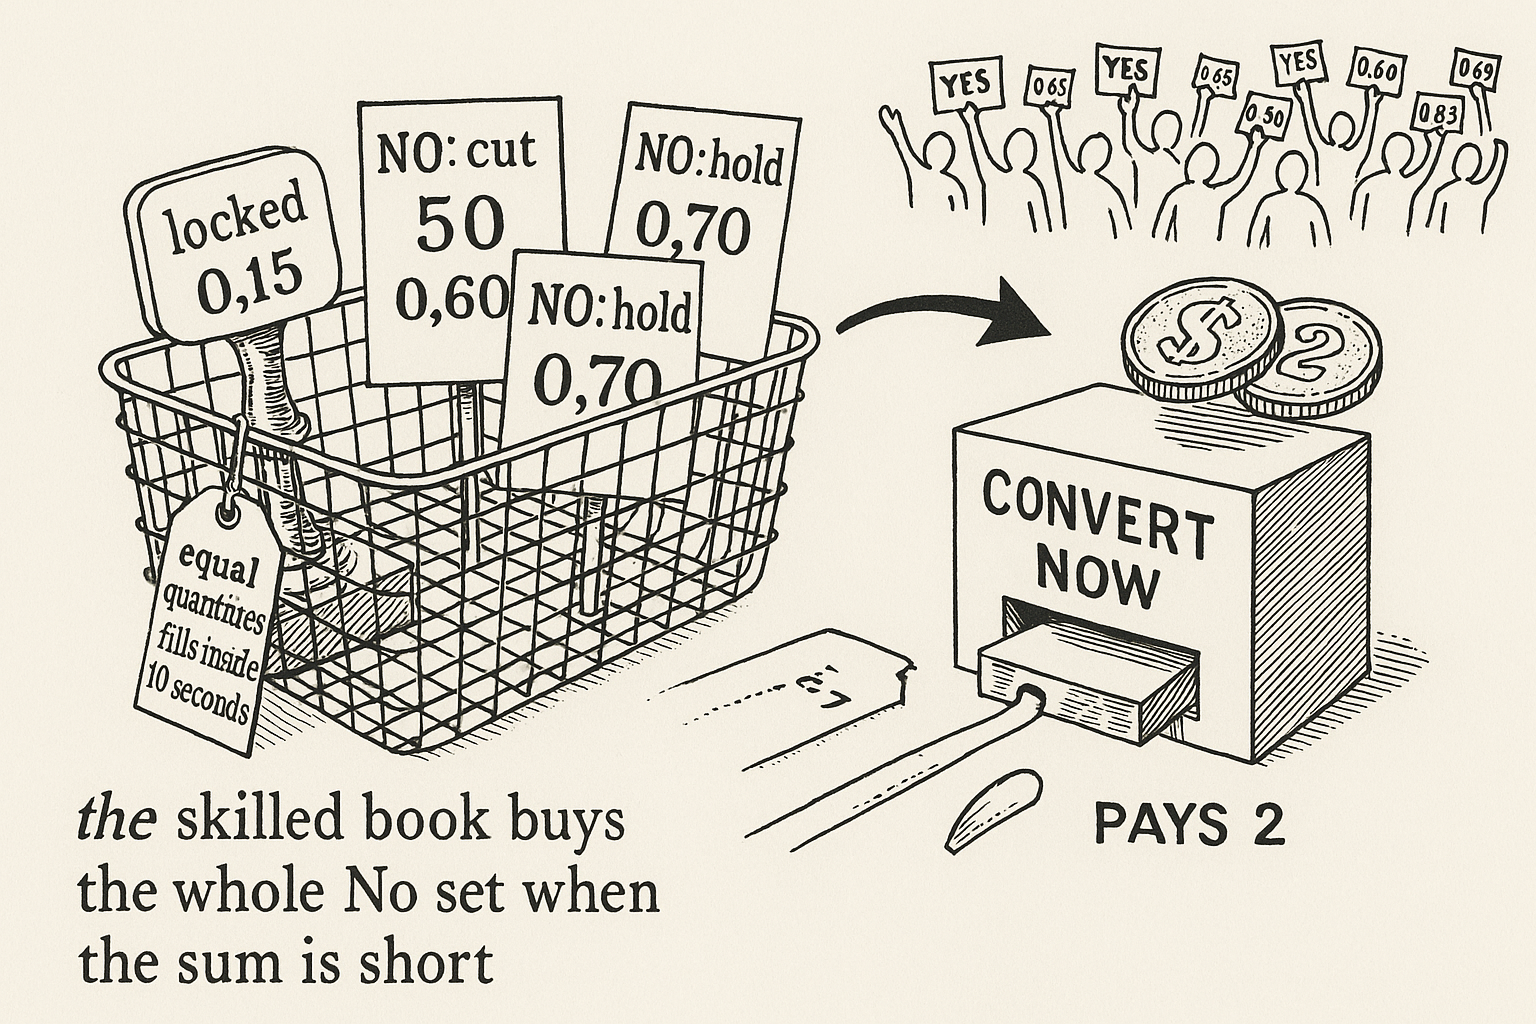
A mutually exclusive event with N outcomes has a complete No basket that converts, immediately, into N − 1 dollars. Polymarket's conversion does that without waiting for the print. The law of one price says the No prices should add to N − 1. When they add to less, buying one No of each outcome locks the gap.
$$ \pi_{\mathrm{basket}} = (N - 1) - \sum_{i=1}^{N} p^{\mathrm{No}}_{i} $$
The profit is per share of the full basket, and you only buy it when the sum of No prices is below N − 1. An event with three outcomes, No prices 0.60, 0.55, and 0.70, sums to 1.85. The basket converts to 2, so the locked profit is 2 − 1.85 = 0.15 a share. They group an account's fills into blocks and start a new block when the gap between fills exceeds 10 seconds. A block counts as this arbitrage when it buys equal quantities of every No in the event. Skilled accounts' net buying of those underpriced baskets exceeds 50 million shares. Every other group's net buying is negligible next to that. An account that spends capital on a 15-cent locked gap is doing a public-price job. The old article "The Complete Prediction-Market Stack (Pillar 9 capstone)" puts this structural gap first in the stack. On this tape the accounts who clear the sign test are the ones who trade it.
Scheduled announcements are the public-price job they measure with a slope. For an FOMC release or an earnings print they define the surprise as the settlement minus the price in the window before the release.
$$ \mathrm{Surprise}_{m} = Y_m - p_{m,\mathrm{before}} $$
The surprise is how far the pre-release price sat from the 0 or 1 that the announcement revealed. A contract at 0.62 that resolves Yes has surprise 1 − 0.62 = 0.38. They regress the change in each group's order imbalance, from the window before the release to the window after, on that surprise. On 21 FOMC releases the skilled slope is 4.99 (t = 3.96). The authors read a one percentage point surprise as a 4.99 percentage point rise in skilled net buying, and they say the FOMC surprise in these markets tops out around six percentage points, so 6 times 4.99 = 29.94 percentage points of order imbalance. That sits inside the −50 to +50 range of 100 times the raw ratio, which runs from −0.5 to 0.5. On 158 earnings announcements the skilled slope is 0.17 (t = 2.62), which they also phrase as 17 basis points of net buying per percentage point of surprise. The skilled slope is the only one that is positive and significant in both panels. Twenty-one FOMC windows is a thin sample. I would not trade the 4.99. The sign, skilled only, is the part that matches the earnings panel.
They also look at the dispute window after a resolution is proposed. Proposed outcomes are rarely overturned, and they report that the skilled accounts are the only group that buys the correct outcome on net in that window. That is the same public-price habit, with no coefficient I am going to promote from the appendix.
The favorite-longshot bias is the flow you can see without a release clock. People pay up for contracts that win rarely and shy away from contracts that win often, so a price of 0.10 happens less than 10% of the time and a price of 0.90 happens more than 90% of the time. The 0.10 contract is overpriced. The 0.90 contract is underpriced. The old article "Do Polymarket Prices Converge? Bias and Volatility Evidence" already measured the low-probability side of that bias on an earlier Polymarket sample. This paper says who is on which side of the trade.
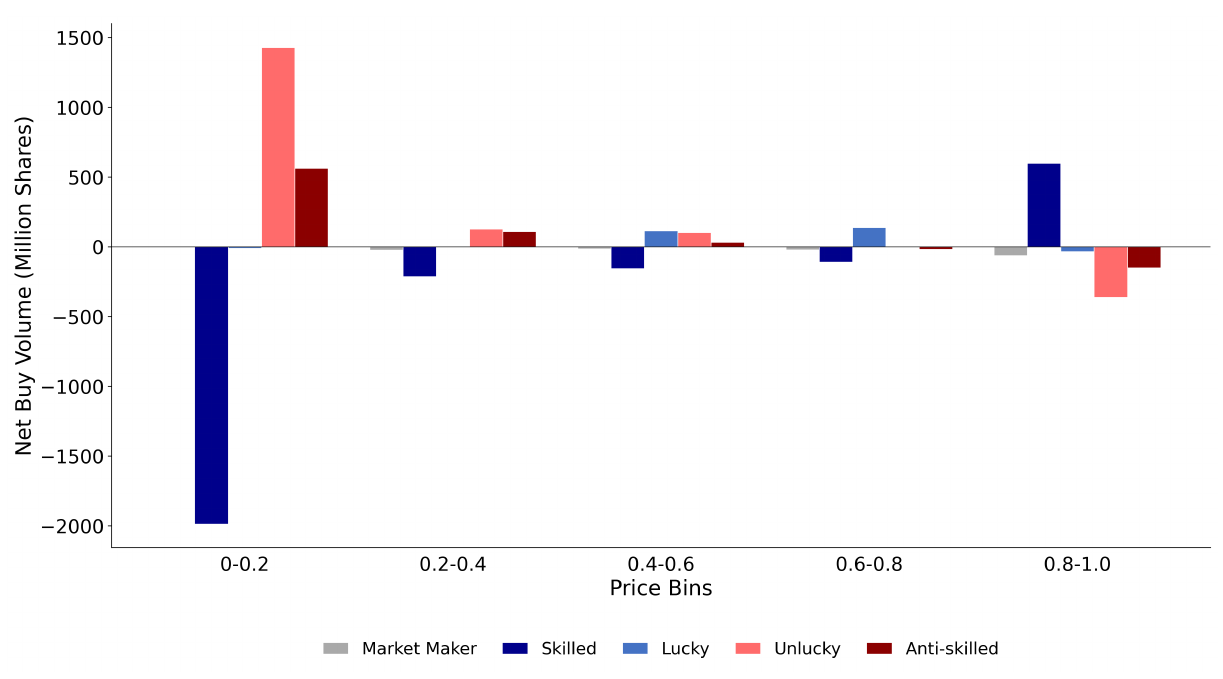
Look at the dark skilled bar in the 0 to 0.2 bin. It is the large negative one. The unlucky and anti-skilled bars in that bin point the other way. In the 0.8 to 1 bin the skilled bar flips positive and those two crowd bars flip negative. The skilled book sells the overpriced longshot and buys the underpriced favorite. The anti-skilled book does the reverse, which is a standing reason to lose money in a place where a scrambled book would be closer to flat. The figure's axis is million shares. The paper does not print the bar heights in the text, so the heights stay in the picture.
The skilled bar points at the print
Look at the skilled bar. In markets that resolved Yes it is the tall bar above zero. In markets that resolved No it is the tall bar below zero. The anti-skilled bar points the other way. The lucky bar has the skilled sign and a smaller size. Market makers lean slightly against the print, which is what you get from accommodating the flow and living on the spread.
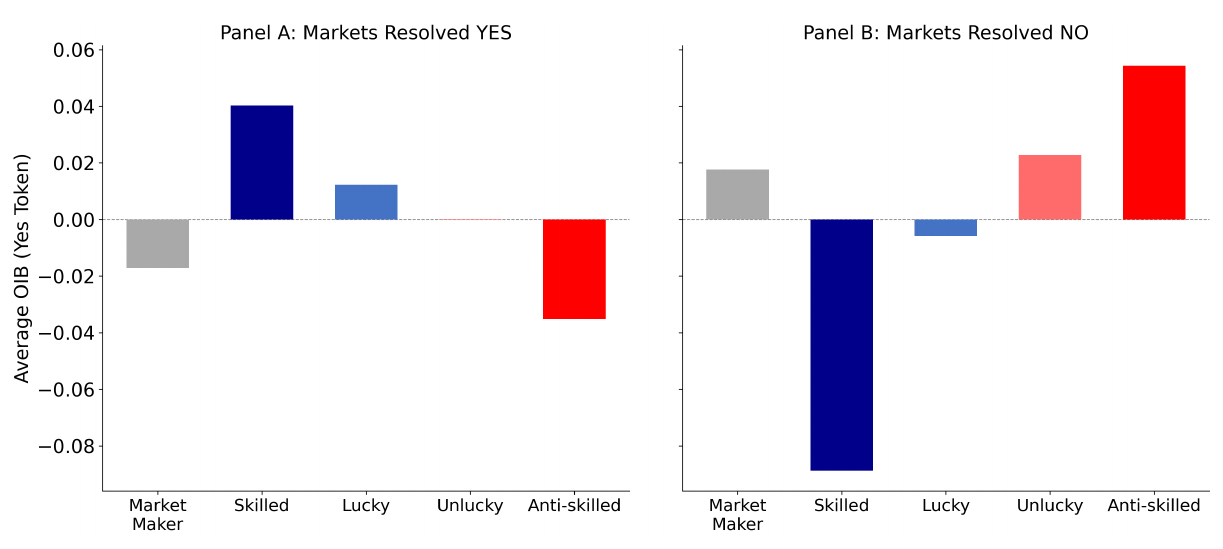
The bars are average order imbalance in the last 5% of each market's life, on the test-set events. The slopes use every bin.
Three slopes, from the skilled column. The next-bin price change loads 2.05 on skilled order imbalance (t = 12.81, 1,267,183 bins). The final outcome loads 7.77 (t = 9.57, 1,362,338 bins). The change in absolute pricing error loads −4.95 on skilled volume share (t = −5.54, 1,265,693 bins). The authors read a one percentage point rise in the ratio as about 2 basis points on the next price, about 8 basis points on the settlement probability, and about 5 basis points less absolute error.
Those sentences and the formulas do not share units. The formulas store order imbalance and volume share as raw ratios. A contract price is in dollars, from 0 to 1. Multiply the printed 2.05 by a 0.01 move in the raw ratio and you get 0.0205 dollars, which is 2.05 cents, or 205 basis points. The same multiplication on −4.95 gives −0.0495 dollars, 4.95 cents, not 5 basis points. The authors' sentence matches the printed slope only if the regression stored the ratio in percentage points and the price change in basis points, a rescaling the formula section does not write down. A 10 percentage point move, on their sentence, is 10 times 2.05 = 20.5 basis points on the next price and 10 times 7.77 = 77.7 basis points on the settlement. On the raw product, 2.05 times 0.10 is 0.205 dollars. I keep both readings. The source may be using "basis point" for a cent, or it may have rescaled off the page. Do not multiply the raw ratio by 2.05 and call the product a dollar price, and do not call 2.05 cents a 2 basis point move, until you re-estimate it.
The fit is tight and small either way. The next-bin regression has an R-squared of 0.001. The settlement regression has an R-squared of 0.327 for the skilled column and 0.325 for the lucky column, so almost all of that fit is the lagged price already in the controls. Order imbalance adds a sliver. The t-statistic is the precision of that sliver on 1,267,183 bins.
The rest of the grid, in one pass: lucky order imbalance loads 0.18 on the next price and 0.74 on the settlement, both with t = 1.45; unlucky loads −1.78 on the next price; anti-skilled loads −2.52 on the next price and −9.74 on the settlement; market makers load +1.26 on the next price and −5.69 on the settlement; on the error regression the crowd slopes are positive (lucky 1.64, unlucky 2.52, anti-skilled 0.70) and the market-maker slope is −0.67 with t = −1.37; the skilled error slope grows from −0.59 in the first fifth of the market's life to −9.53 in the last fifth, and 9.53 / 0.59 = 16.15.
Date-cut the screen, or you are the crowd
The paper's split assigns events at random across the whole sample, because a late-2025 wave of new accounts would wreck a calendar split. That choice balances the user base, and it leaks. An account's skill label can depend on an event that resolves after the bin you are trying to explain. The 46% persistence mixes events from the whole sample, so a 2024 screen could not have used it. A live screen needs a date cut: label on events resolved before today, then score bins that happen after. The authors do not report that cut. That is the missing input.
If you still build the label, do it in their order. Drop market makers first, on the 100-market, 70% limit, 70% both-sides rule. Require ten events. Below four events the p-value cannot reach 0.05, and from four to nine it can, which is why they still refuse the label: they want the null p-value close to uniform. Draw event-level signs, B = 1,000, half-count the ties, truncate at 2 to the power of −(E+1). Keep p below 0.05. If you also run the false-discovery cut, the headcount falls to 1.95%, and in that appendix the skilled slopes are 2.39 on the next price, 9.07 on the settlement, and −6.61 on the error. Two other nulls, one that also reshuffles size and one that redraws the settlement from the fill price, leave the skilled error slope at −6.67 and −5.88. The skilled error slope stays negative under both nulls.
There is no platform fee in the sample. The fill price is already inside the profit sum, so the spread you crossed is charged. The paper is silent on gas and on failed Polygon transactions. Directional inventory sits until the oracle resolves the market. The No basket converts immediately, so the clock on that trade is latency and gas. The average skilled profit of $3,243 on $115,392 of volume has no holding period attached, and the authors do not print a yield.
Insiders are a real local object and a bad account of the tape. The record screen wants a per-share win rate of at least 90%, profit per share of at least 0.1, at least $1,000 of profit, and at least 90% of that profit in markets an LLM rubric called insider-prone. The win-rate leg without the 0.1 profit-per-share leg would flag skilled favorite-buyers, which is why both cuts are there. The timing screen wants an account opened no more than seven days before one insider-prone event, no trades after it, only that event, and at least $1,000 traded and earned. The conviction screen wants a winning trade that moves the price by 0.2 or more, more than half of profits from markets traded that way, and at least $1,000 of profit. Together, after overlap, that is 967 accounts: 0.2% of volume, 1.3% of profits, active in 7.5% of time bins inside the markets they touch, and 11 of them also skilled. Those 11 are 1.1% of the flagged insiders and 11 / 54,325 = 0.02% of the skilled headcount.
Where the flagged accounts trade, their settlement slope is 22.54 and their error slope is −8.79, against 9.82 and −2.99 for skilled accounts with the insiders removed. Their next-bin slope is 1.91, and the skilled next-bin slope on the same markets is 2.95. The authors write that each insider effect is larger than the skilled effect. The settlement slope and the error slope are larger. The next-bin slope goes the other way, 1.91 against 2.95. I keep the table and flag the sentence. The source overclaimed "each." The illustration they give is the January 2026 Maduro contract, three accounts, profits over $620,000, after the main sample's resolution cutoff of 31 December 2025. A sports price walks toward the score on the skilled flow. This case is three accounts.
The skilled slopes are still there on markets the rubric called not insider-prone, which is 89% of markets. Sports and crypto are labeled "no" on 98.6% and 98.7% of their markets. On the not-prone set the skilled slopes are 1.90 on the next price, 7.49 on the settlement, and −5.44 on the error. The rubric is Claude Haiku with a written rule (someone can control the outcome, or know it in advance) plus 100 hand-labeled examples. Treat the rubric as a sample split. I am against reading this tape as insider flow.
I am against ranking accounts by profit. The training-set winners reverse, and the lucky account's higher profit per dollar of volume is the concentration of one event. If your own book is long the 0.10 contract and short the 0.90 contract, you are the crowd in the longshot figure, and the skilled bar is the other side. The trade that matches the rest of this pillar is the No basket: sum the No prices, and if they sit below N − 1, the conversion is a locked gap the skilled accounts are already buying, at more than 50 million shares. What is left after their 50 million is a latency race the paper prices at zero fees. More crowd volume, on the error regression, lines up with prices moving away from the print. The account that carries the price is the one that survives the scramble.
KEY POINTS
- Scramble each account at the event level, half-count ties, and keep p below 0.05 only after ten events. The unadjusted cut is 54,325 accounts, 3.16% of the tape.
- Hold out events before you trust the label. Skill persists for 46% of those accounts, against 10% of mutual funds in the authors' four-factor split, and 64% of the lucky lose.
- Score a bin by order imbalance with every share in the denominator. The skilled settlement slope is 7.77; the lucky slope is 0.74 and its t-statistic is 1.45.
- Treat skilled volume as the share that lines up with a smaller absolute pricing error. The pooled slope is −4.95, and it is −9.53 in the last fifth of the market's life.
- Do not explain the tape with insiders. The three proxies cover 0.2% of volume. Sell the rich longshot, and lock the No basket when the No prices sum to less than N − 1.
References
- Do Polymarket Prices Converge? Bias and Volatility Evidence
- The Complete Prediction-Market Stack (Pillar 9 capstone)
- What a Market Price Actually Is: Capital-Weighted Consensus and the Brier Skill Score Gate
- Prediction Market Accuracy: Crowd Wisdom or Informed Minority? - Gómez-Cram, Guo, Jensen, and Kung
A note on AI. The ideas, research, analysis, and conclusions in this article are my own. I use AI tools to help with editing and wordsmithing, because English is not my first language, and I am not shy about that. AI-generated ideas and AI-assisted writing are not the same thing: the first is empty slop from a generic prompt, the second is a tool for communicating years of real research more clearly. Judge the work by its substance, not by whether software helped polish the prose.