6.58 Dual Momentum Between Gold and Bitcoin (Two Stores of Value)
Dual momentum on GLD vs IBIT posts 79.91%/yr at 8 weeks, Sharpe 1.64, DD still -44%. That lookback won a 10-spec in-sample grid. A 20% vol cap leaves 12% at Sharpe 1.37.
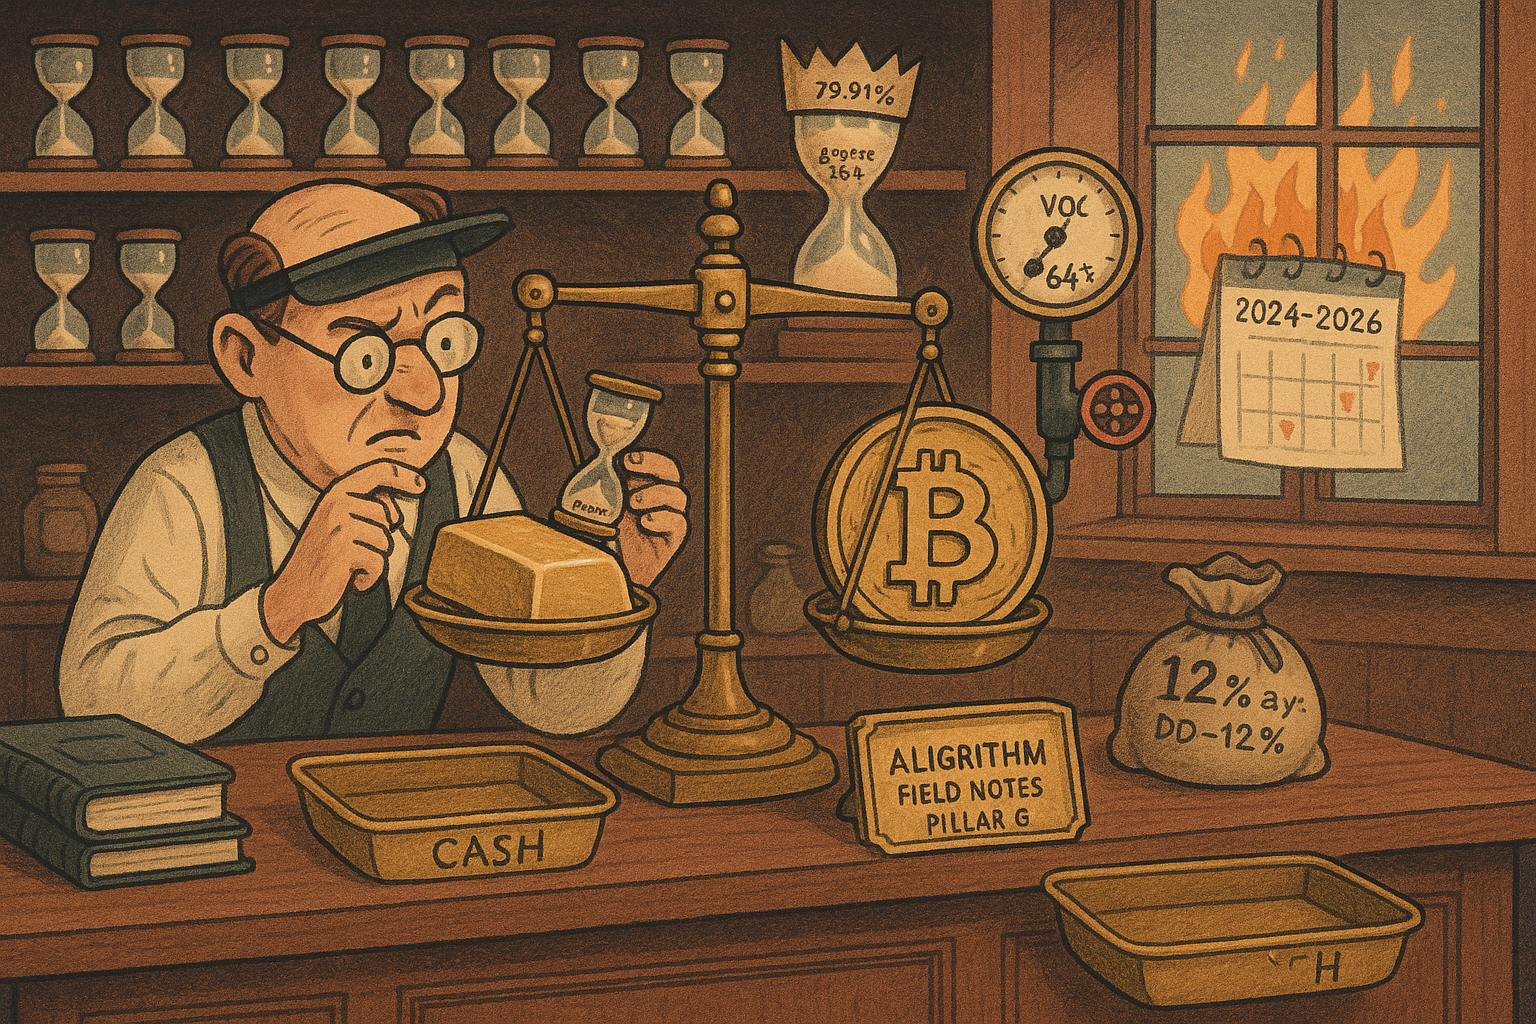
An 8-week dual-momentum switch between GLD and IBIT returns 79.91% a year at a Sharpe of 1.64. Vojtko and Dujava report that number on a Quantpedia note covering 31 December 2018 through April 2026, weekly rebalance at Wednesday's close, cash when both lookbacks print negative. Hold the other column: maximum drawdown is still -43.94%. They tested ten lookbacks and published the peak. The equity curve that produces the 80% sits with the rest of the grid until 2024, then rips. The rule is Antonacci relative-plus-absolute momentum on two tickers. The result is an in-sample trophy from the easiest Bitcoin stretch in the sample.
I am against treating 79.91% as a live expectation. The number that a mandate could live with is the 20% volatility cap on their 4/8/12 composite: 12.01% a year, Sharpe 1.37, drawdown -12.27%. That one still comes off the same grid.
Two stores of value, one blend that does not help
Gold's above-ground stock grows about 1 to 2% a year, which is Erb and Harvey's supply argument for why the metal keeps a monetary premium. Bitcoin copies the scarcity story with a programmed halving. Baur, Hong and Lee treat Bitcoin as a speculative asset, not a medium of exchange. Corbet, Meegan, Larkin, Lucey and Yarovaya show that in stress it trades with risk assets, which is the opposite of a store of value. The Quantpedia note asks a narrower question: if you refuse the ideology and just rotate the two, does dual momentum beat holding either one, or a 50/50.
They use GLD for gold. Bitcoin is a splice: Bitfinex hourly BTC, then BITO, then IBIT after the spot ETF, timestamped to GLD's NYSE close. IBIT listed in January 2024. Everything before that is a proxy, not the live vehicle.
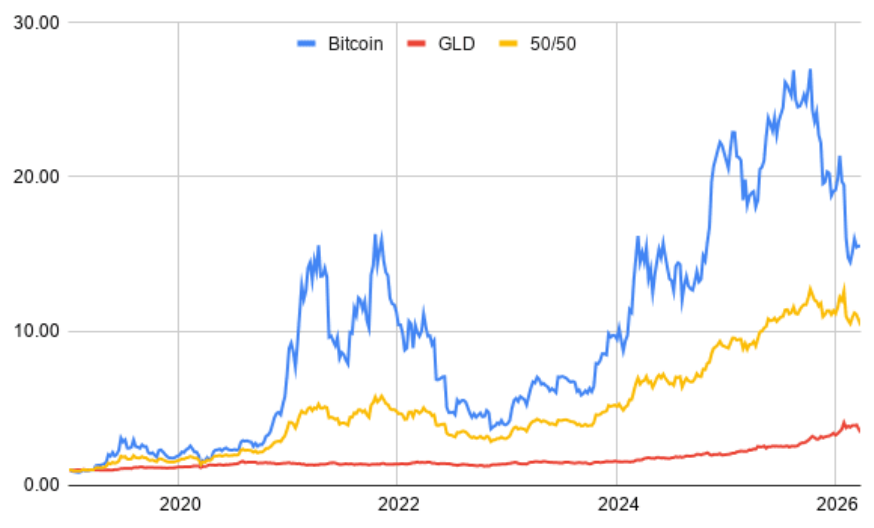
Bitcoin compounds at 46.66% a year with 64.01% volatility and a -77.49% drawdown, Sharpe 0.73 at a 0% risk-free rate. GLD does 18.80% at 17.09% vol and -20.71% drawdown, Sharpe 1.10. The 50/50 prints 38.65% at 34.44% vol and still eats a -50.99% hole, Sharpe 1.12. Check the ratios off their Table 1: 46.66 / 64.01 = 0.73, 18.80 / 17.09 = 1.10, 38.65 / 34.44 = 1.12. Calmar is performance over the absolute drawdown, so Bitcoin 46.66 / 77.49 = 0.60, gold 18.80 / 20.71 = 0.91, 50/50 38.65 / 50.99 = 0.76. The blend captures Bitcoin's direction and a large fraction of Bitcoin's crash. Equal weights do not solve a 64-versus-17 volatility gap.
Relative plus absolute, never both
Antonacci's 2016 dual-momentum rule has two gates. Relative momentum picks the winner between the two assets over a lookback of X weeks. Absolute momentum requires that winner's lookback return to be positive, otherwise the book goes to cash at 0%. They never hold both. It is a switch, not a blend.
$$ w_t = \begin{cases} \text{IBIT} & \text{if } R^{\text{IBIT}}_{t-X:t} > R^{\text{GLD}}_{t-X:t} \text{ and } R^{\text{IBIT}}_{t-X:t} > 0 \\ \text{GLD} & \text{if } R^{\text{GLD}}_{t-X:t} > R^{\text{IBIT}}_{t-X:t} \text{ and } R^{\text{GLD}}_{t-X:t} > 0 \\ \text{cash} & \text{otherwise} \end{cases} $$
R-IBIT over t-minus-X to t is IBIT's total return across the last X weeks, same for GLD. At each Wednesday close the rule compares those two numbers to each other and to zero, then holds one name or nothing until next Wednesday. Worked reading with X = 8. IBIT +12% over eight weeks, GLD +3%: relative winner is IBIT, absolute gate is open, so 100% IBIT. IBIT -8%, GLD +2%: long GLD. IBIT -8%, GLD -3%: both fail the zero test, cash. IBIT +5%, GLD +7%: long GLD. The cash state is the crash brake. It is also an 8-week delayed crash brake, which is why a -43.94% drawdown survives the "otherwise cash" clause. Bitcoin's 2022 drawdown ran for months. An 8-week window stays positive deep into a decline, then flips after the damage is already on the sheet.
X is the only free parameter. They try 1, 2, 3, 4, 6, 8, 12, 20, 24 and 28 weeks. Ten specs, one sample, no walk-forward.
The old article "Percentile-Rank Momentum With Hysteresis: Low-Churn Signals" attacked the same problem from the other side: rank a move against its own signed history and put a hysteresis band on entries so the signal stops flip-flopping, then check the rule on a grid of walk-forward splits. This note does the opposite. It mines a single lookback on one path and calls the peak a sweet spot.
Ten lookbacks, one trophy
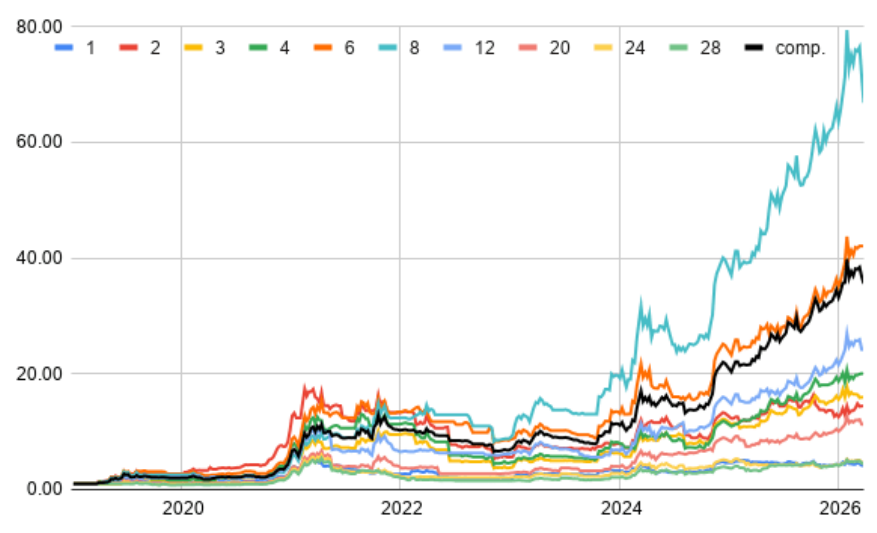
Table 2, pure dual momentum, 31 December 2018 to April 2026:
| X (weeks) | 1 | 2 | 3 | 4 | 6 | 8 | 12 | 20 | 24 | 28 | Comp. |
|---|---|---|---|---|---|---|---|---|---|---|---|
| Ann. % | 22.04 | 45.21 | 47.22 | 52.00 | 68.66 | 79.91 | 56.09 | 40.31 | 23.03 | 22.75 | 64.73 |
| Vol % | 45.48 | 45.68 | 47.28 | 47.78 | 46.12 | 48.85 | 47.88 | 48.68 | 47.25 | 46.55 | 44.14 |
| Sharpe | 0.48 | 0.99 | 1.00 | 1.09 | 1.49 | 1.64 | 1.17 | 0.83 | 0.49 | 0.49 | 1.47 |
| Max DD % | -65.19 | -69.42 | -63.78 | -66.78 | -48.23 | -43.94 | -49.98 | -59.32 | -66.02 | -72.84 | -49.40 |
| Calmar | 0.34 | 0.65 | 0.74 | 0.78 | 1.42 | 1.82 | 1.12 | 0.68 | 0.35 | 0.31 | 1.31 |
Comp. is an equal-weight mix of the 4-, 8- and 12-week variants. Check the bold column: 79.91 / 48.85 = 1.64, 79.91 / 43.94 = 1.82. Composite: 64.73 / 44.14 = 1.47, 64.73 / 49.40 = 1.31. The arithmetic matches the table.
The 50/50 Sharpe is 1.12. Seven of the ten lookbacks print Sharpe at or below 1.09. The three that beat 1.12 are 6, 8 and 12 weeks. Their "composite to mitigate parameter sensitivity" averages 4, 8 and 12, which is the interior of that cluster plus the 4-week edge that almost ties the blend. It is not an average of the grid. It is an average of the specs that work.
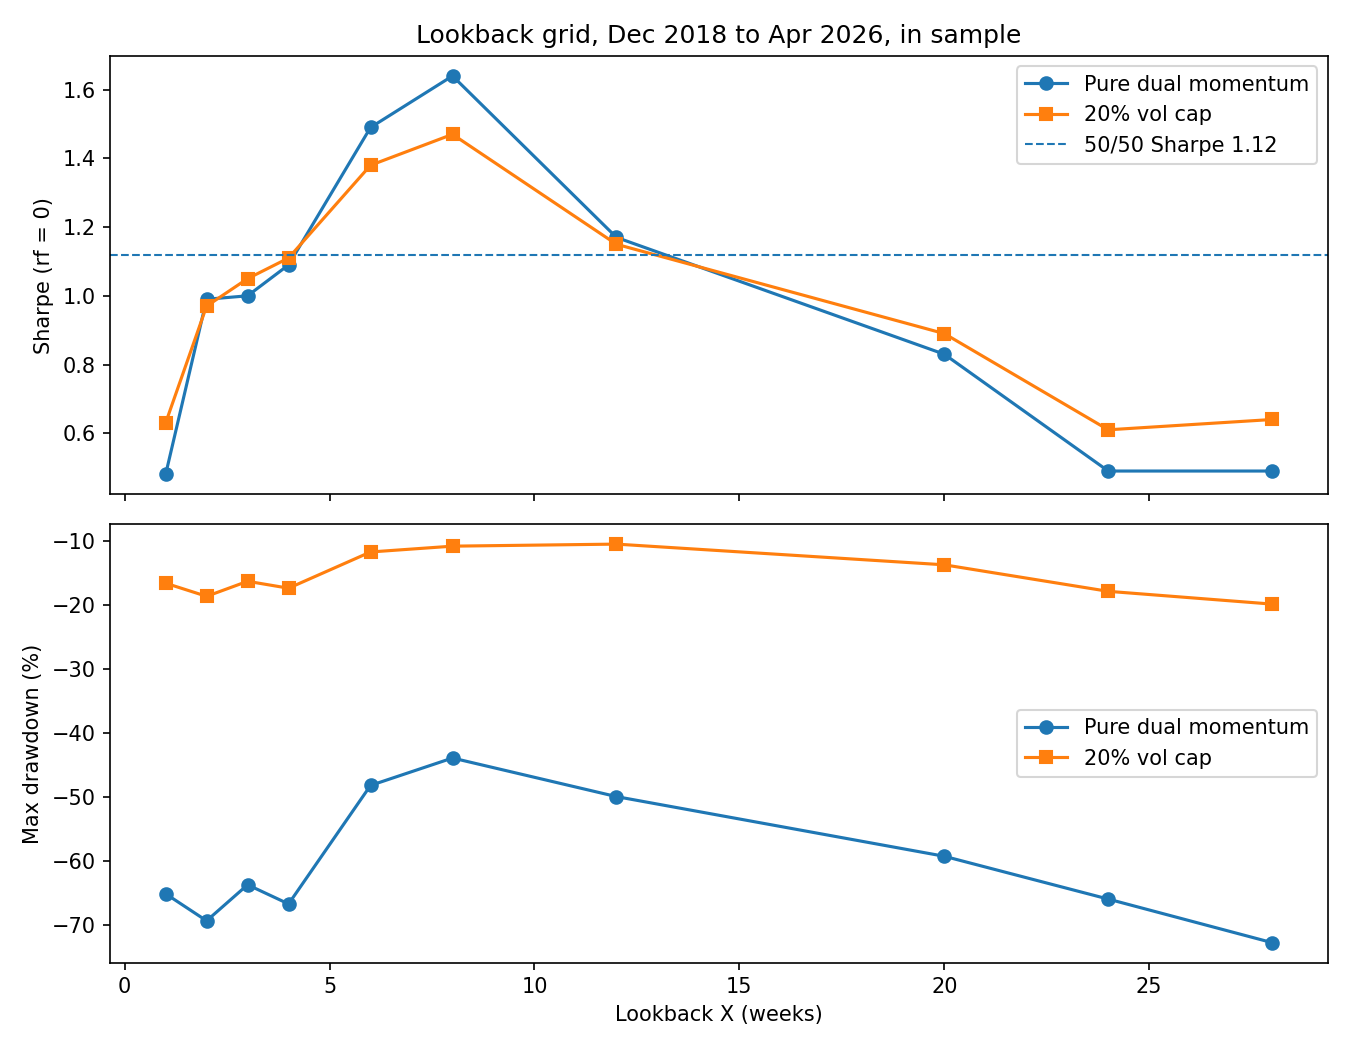
The top panel is an inverted U with a spike at 8 weeks. The bottom panel never gets the pure switch's drawdown above -43%. Volatility across lookbacks sits in a tight band around 46 to 49%, so the Sharpe ranking is almost a return ranking. The strategy does not change risk. It changes how often you are in Bitcoin during a Bitcoin bull.
Read the equity chart against that grid. The 8-week line (teal) tracks the pack through 2023 and then leaves everyone behind in 2024-2026, finishing near 80x. A 79.91% geometric rate over about 7.3 years compounds to roughly (1.7991)^7.33 ≈ 74x, which is the same picture as the chart's "near 80" once you allow for lookback burn-in and a visual read of the last print. The outperformance is concentrated in the last two years of the sample, which is also when the authors wrote the note (6 May 2026, sample through April 2026).
The 20 percent cap is the actual product
Bitcoin's 64% vol against gold's 17% means a 100% switch into IBIT is an equity-like book one week and a crypto book the next. They add a hard 20% annualized volatility ceiling, not a target. After the dual-momentum signal picks IBIT or GLD, they take that name's 12-week rolling weekly standard deviation, annualize it, and scale the position.
$$ \sigma^{\mathrm{ann}}_t = \sigma^{\mathrm{weekly}}_{t-12:t} \times \sqrt{52}, \qquad w_t = \min\left(\frac{0.20}{\sigma^{\mathrm{ann}}_t},\, 1\right) $$
Sigma-weekly is the standard deviation of the selected asset's Wednesday-to-Wednesday returns over the last 12 weeks. Square root of 52 is about 7.21, so a weekly sigma of 8.87% annualizes to 8.87 × 7.21 ≈ 64%, Bitcoin's full-sample vol. The weight is then 0.20 / 0.64 = 0.3125, so 31% in IBIT and 69% in cash. Their own examples: 23% annualized vol → 20/23 ≈ 87% invested, 13% cash; 15% vol → 100%, because the min with 1 caps the book at fully invested; 40% vol → 50%. Units cancel: percent over percent. The 20% is an arbitrary institutional round number. They say so. It is chosen to look like equity risk.
Table 3, same dates, 20% cap:
| X (weeks) | 1 | 2 | 3 | 4 | 6 | 8 | 12 | 20 | 24 | 28 | Comp. |
|---|---|---|---|---|---|---|---|---|---|---|---|
| Ann. % | 5.75 | 8.85 | 9.95 | 10.57 | 12.69 | 14.36 | 10.90 | 8.61 | 5.75 | 5.90 | 12.01 |
| Vol % | 9.10 | 9.14 | 9.48 | 9.55 | 9.21 | 9.75 | 9.50 | 9.70 | 9.39 | 9.24 | 8.77 |
| Sharpe | 0.63 | 0.97 | 1.05 | 1.11 | 1.38 | 1.47 | 1.15 | 0.89 | 0.61 | 0.64 | 1.37 |
| Max DD % | -16.58 | -18.63 | -16.28 | -17.36 | -11.69 | -10.78 | -10.46 | -13.70 | -17.85 | -19.85 | -12.27 |
| Calmar | 0.35 | 0.48 | 0.61 | 0.61 | 1.09 | 1.33 | 1.04 | 0.63 | 0.32 | 0.30 | 0.98 |
8-week column: 14.36 / 9.75 = 1.47, 14.36 / 10.78 = 1.33. Composite: 12.01 / 8.77 = 1.37, 12.01 / 12.27 = 0.98. Again the table is internally consistent.
The cap takes the composite from 64.73% at 44.14% vol and -49.40% drawdown down to 12.01% at 8.77% vol and -12.27% drawdown. Realized vol at 8.77% is less than half the 20% ceiling, and less than gold's standalone 17.09%. That gap is the cash. Absolute momentum parks the book when both lookbacks are negative, and the cap itself cuts IBIT to ~30% whenever Bitcoin is running at 60%+ vol. The Sharpe holds up (1.47 → 1.37 on the composite) because return and vol fall together. The Calmar does not: 1.31 down to 0.98. Drawdown compression is smaller, relative to the return haircut, than vol compression.
What the backtest leaves on the table
The Sharpe uses a 0% risk-free rate. They print that in the table note. From 2023 onward T-bills paid around 5%. Subtract 5 points from the capped composite and keep vol at 8.77: (12.01 - 5) / 8.77 = 0.80. The pure 8-week is more robust to that haircut because 79.91 is large: (79.91 - 5) / 48.85 = 1.53. The product a risk desk would fund is the capped one, and that is the one the zero-rate convention flatters.
No transaction costs. Weekly rotation between two liquid ETFs is cheap, so this is not the usual crypto-cost ambush. It is still a missing line. A Wednesday GLD-to-IBIT switch pays two spreads plus any premium/discount on the ETF. BITO, the pre-IBIT sleeve, is a futures fund with roll drag the Bitfinex BTC series does not have. The backtest is cleaner than the live book on the Bitcoin leg until January 2024.
Ten lookbacks on one 7-year path, then a composite built from the three that cluster at the peak. No out-of-sample split, no permutation of the Wednesday clock, no embargo. The 2024-2026 burst in Figure 2 is inside the estimation sample. Dual momentum as a framework can be sound and this particular 8-week print can still be a fitted spike. Those two statements do not contradict.
The authors disclose that Qwen3.6-Plus helped with LaTeX, structure, and typesetting, and they claim the research design and numbers are theirs. Take them at their word on the tables. The disclosure does not change the lookback grid.
One more structural limit they do state. When Bitcoin and gold both sell off, relative momentum has nothing to rotate into, and absolute momentum is only as fast as X. The 2022 risk-off window is why the pure switch still prints drawdowns of 44 to 73% depending on lookback. The cap is what turns that into a -12% event. If the pitch is "digital gold plus physical gold, systematically combined," the honest version is "rotate them, sit in cash when both lookbacks are negative, and never let the book run above 20% vol." The 79.91% is what happens if you skip the last clause and pick the lookback after you see the path.
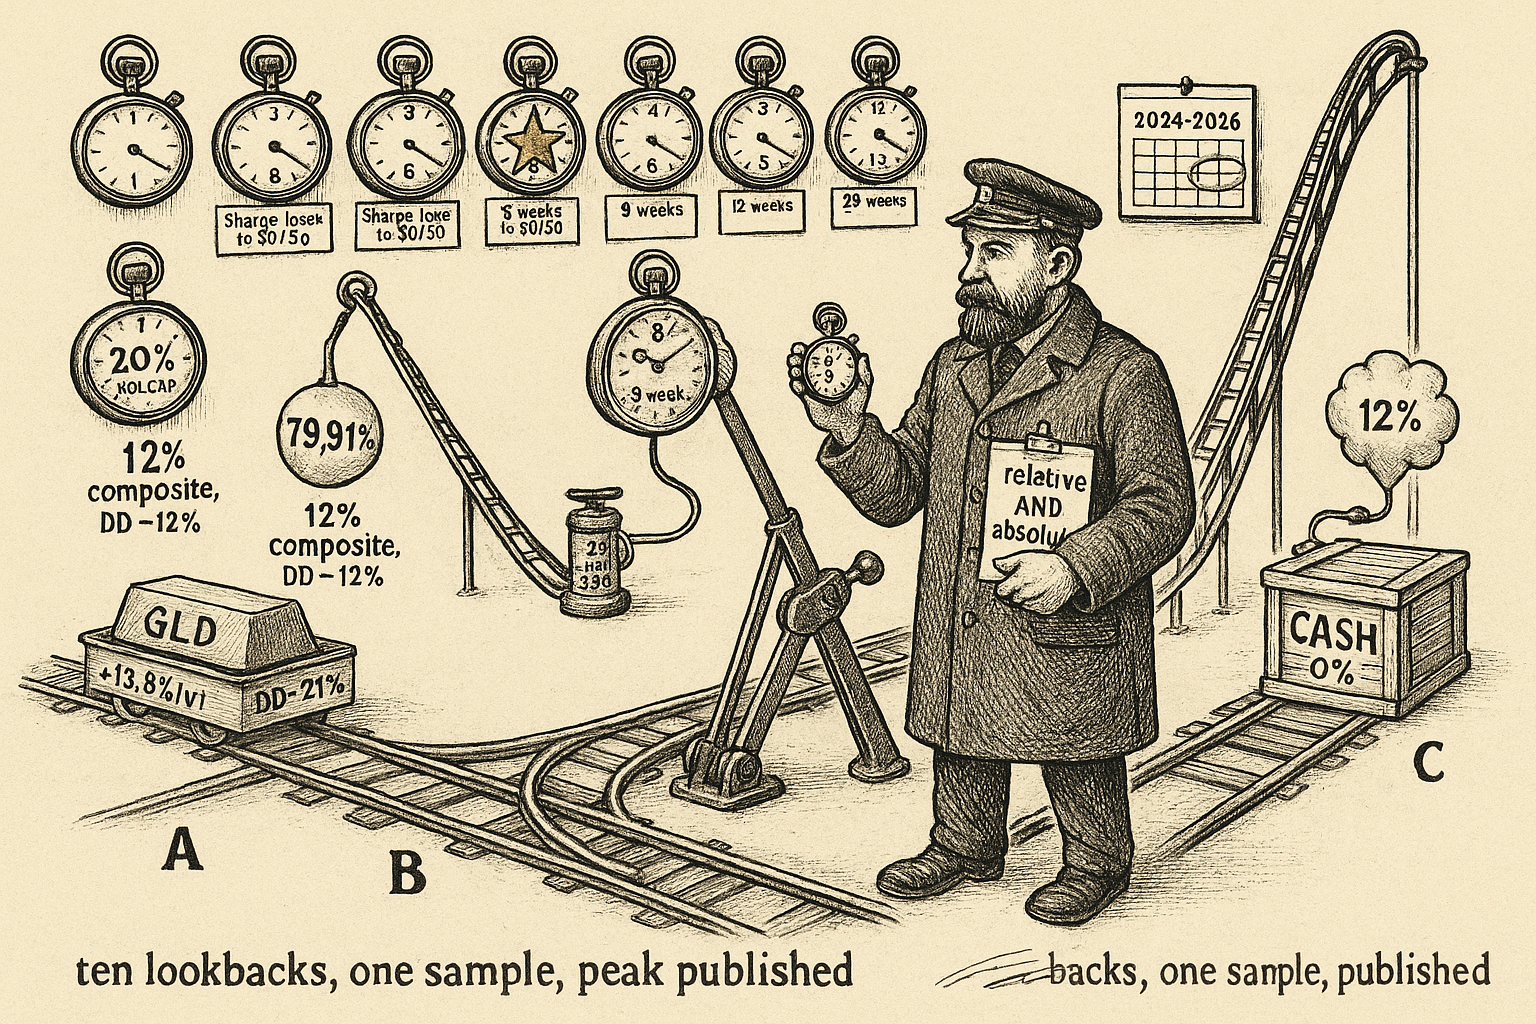
KEY POINTS
- Dual momentum here is a weekly Wednesday switch between GLD and IBIT, long the lookback winner only if that lookback return is positive, else cash. Never both names at once.
- Buy-and-hold: Bitcoin 46.66% a year, vol 64.01%, Sharpe 0.73, drawdown -77.49%. GLD 18.80%, 17.09%, 1.10, -20.71%. 50/50 38.65%, 34.44%, 1.12, -50.99%. The blend does not fix Bitcoin's crash.
- Pure 8-week switch: 79.91% a year, Sharpe 1.64, drawdown -43.94%, Calmar 1.82. That lookback is the peak of a 10-spec in-sample grid. Seven of ten lookbacks fail to beat the 50/50 Sharpe of 1.12.
- The 4/8/12 composite (64.73%, Sharpe 1.47, DD -49.40%) averages the interior of the peak, not the full grid. The 8-week equity curve separates from the pack in 2024-2026.
- A 20% vol cap, weight = min(0.20 / annualized 12-week vol, 1), turns the composite into 12.01% a year, Sharpe 1.37, drawdown -12.27%, realized vol 8.77%. Realized vol sits under the cap because of cash from the absolute gate plus IBIT being sized to ~30% at Bitcoin-like vol.
- Sharpe is computed at rf = 0. Haircut the capped composite by a 5% bill rate and Sharpe falls to about 0.80. Pre-January 2024 Bitcoin is a Bitfinex/BITO proxy, not IBIT. No costs, no out-of-sample split.
References
- Risk Premia Harvesting Through Dual Momentum
- The Golden Dilemma
- Bitcoin: Medium of Exchange or Speculative Asset?
- Exploring the Dynamic Relationships Between Cryptocurrencies and Other Financial Assets
- Dual Momentum Allocation Between Physical Gold and Bitcoin (Digital Gold)
A note on AI. The ideas, research, analysis, and conclusions in this article are my own. I use AI tools to help with editing and wordsmithing, because English is not my first language, and I am not shy about that. AI-generated ideas and AI-assisted writing are not the same thing: the first is empty slop from a generic prompt, the second is a tool for communicating years of real research more clearly. Judge the work by its substance, not by whether software helped polish the prose.