2.65 ADX Done Right: Two-Level Smoothing
The ADX is not a price indicator, it is a ratio of ATR-normalized range expansions with two hidden smoothing stages. Build it right and you get a stationary trend-strength filter, but respect the lag: it stays high after sharp trends die.

Everyone knows the ADX as the line that tells you whether a market is trending or chopping, and almost nobody who plots it can tell you what it actually computes or why it has two separate smoothing stages buried inside it. That ignorance is fine until you try to use it as a model feature, at which point the construction details decide whether you have a stationary, comparable signal or a volatility artifact. The old article "Why ATR Normalization Is More Than a Volatility Trick" gave the key: the ADX is not a price indicator at all, it is a ratio of ATR-normalized range expansions, and once you see it that way the whole thing makes sense.
What the ADX is trying to measure
Wilder built the ADX to answer one question, how strong is the trend, with no opinion on direction. It is a strength gauge, so it pairs with a directional signal rather than standing alone. The raw material is not the close. It is the bar-to-bar change in the highs and the lows, treated separately, on the logic that a market making higher highs is expressing upward pressure and one making lower lows is expressing downward pressure, and the ADX cares about how lopsided that pressure is.
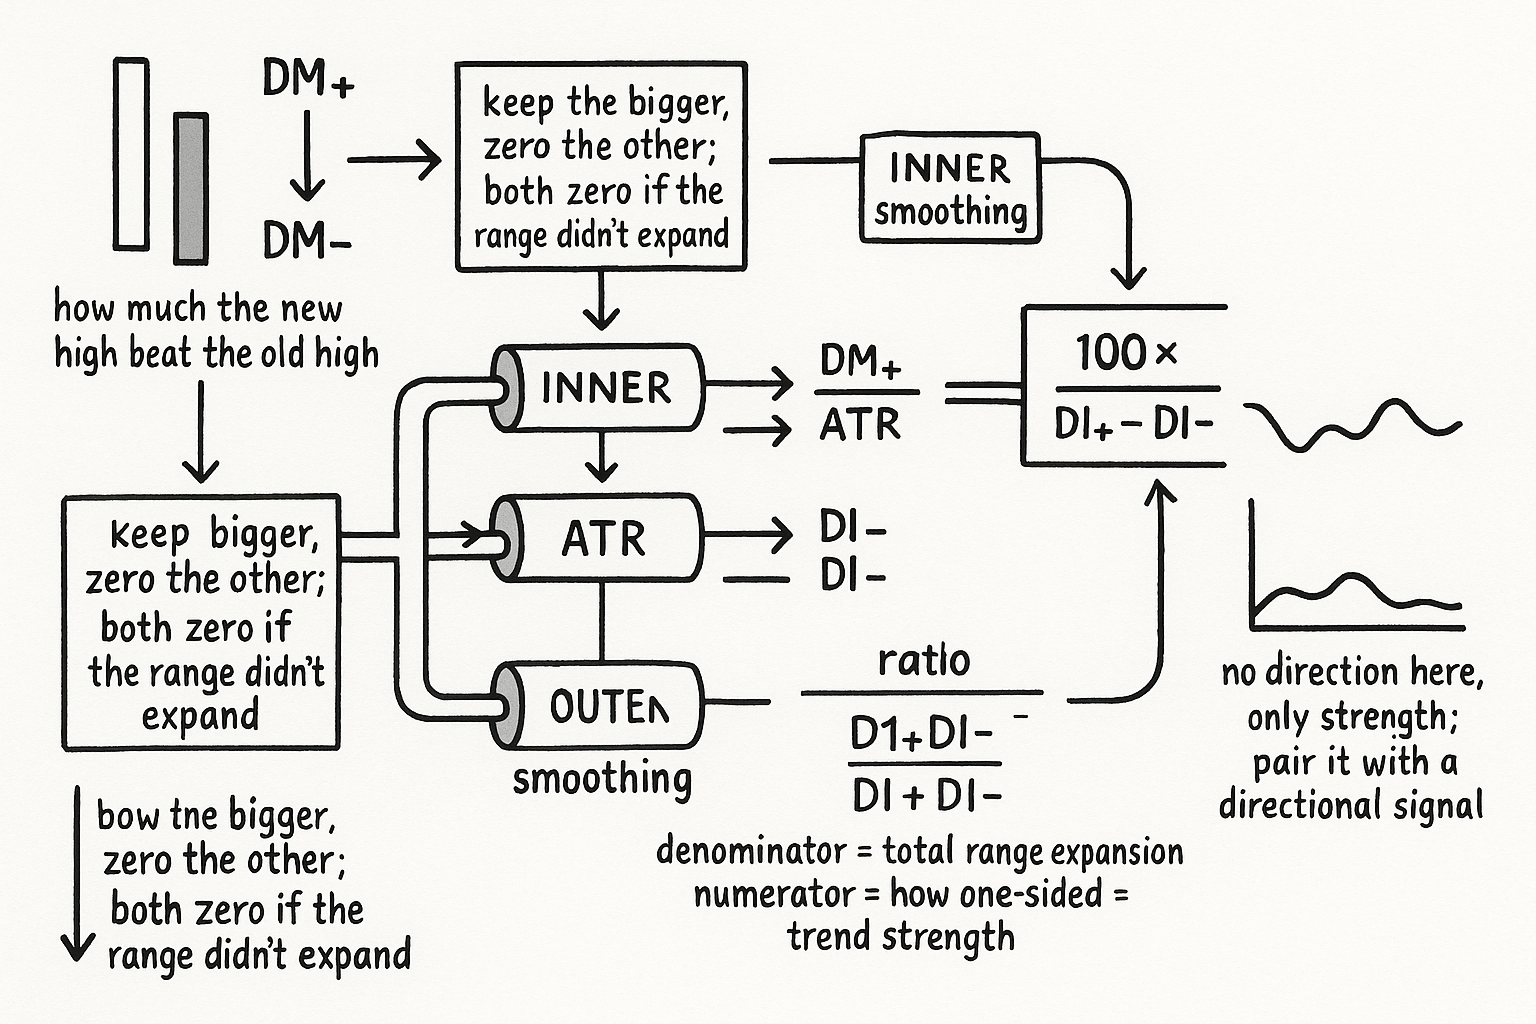
For each bar, measure how much the current high exceeds the prior high, and how much the current low undercuts the prior low. Compare the two and keep only the larger as that bar's directional movement, setting the other to zero, and if even the larger one is negative, set both to zero. The rule sounds fussy but the intent is clean: count a bar only when the price range expanded past the prior bar, a higher high or a lower low, and ignore inside bars where the range contracted and neither extreme was beaten.
$$ \text{DM}^{+} = H_t - H_{t-1}, \qquad \text{DM}^{-} = L_{t-1} - L_t $$ $$ \text{keep the larger, zero the other; if the larger} < 0,\ \text{both} = 0 $$
The terms with H and L are this bar's and the prior bar's high and low, so the plus movement is how far the high pushed up and the minus movement is how far the low pushed down. Keeping only the dominant one per bar is what makes the eventual oscillator read range expansion rather than mere wiggle.
Two levels of smoothing, and the ATR denominator
These raw movements are too volatile to use directly, a single dramatic bar swamps them, so the first smoothing pass, the inner level, averages each of the three quantities separately: the plus movement, the minus movement, and the ATR. The smoothing is the same EMA-style recursion the RSI and the rest of Wilder's indicators use.
$$ S_t = \frac{(L-1)\,S_{t-1} + X_t}{L} $$
The term X is the quantity being smoothed on the current bar, S is its running smoothed value, and L is the lookback. Now the ATR normalization does the real work. Divide each smoothed directional movement by the smoothed ATR and you convert raw price-unit movements into dimensionless directional indicators that mean the same thing on any instrument in any volatility regime.
$$ \text{DI}^{+} = \frac{\text{DM}^{+}}{\text{ATR}}, \qquad \text{DI}^{-} = \frac{\text{DM}^{-}}{\text{ATR}} $$ $$ \text{Raw ADX} = 100 \cdot \frac{\lvert\, \text{DI}^{+} - \text{DI}^{-}\,\rvert}{\text{DI}^{+} + \text{DI}^{-}} $$
This is the old ATR article's thesis made literal: ATR is the structurally correct denominator because the directional movements are price-unit quantities generated by the same volatility, so dividing by ATR removes the regime and leaves a pure shape. Read the ratio's two pieces. The denominator, plus-DI plus minus-DI, is the total range expansion the market produced, up moves and down moves added together. The numerator, the absolute difference, is how one-sided that expansion was. Their ratio is the fraction of total expansion that pointed one way, which is exactly what "trend strength regardless of direction" should mean: a market expanding hard but evenly in both directions scores low, and one expanding all in one direction scores near 100.
The outer smoothing is the second level. The raw ADX itself is still jumpy, so smooth it again with the same recursion to get the line you plot. Two stages, inner on the components and outer on the ratio, which is the detail the indicator's name hides and the reason it behaves as a stable trend-strength reading instead of a twitchy one.
The lag it carries, and how to use it
The ADX done this way is a bounded, stationary, cross-instrument trend-strength feature, which is what you want, and it comes with a built-in delay you must respect. Two smoothing passes mean the line reacts late, and the lag bites hardest at the end of sharp trends: a strong move that suddenly dies leaves the ADX elevated for several bars, still reporting strength that has already evaporated. So read a high ADX as confirmation that a trend has been strong, not as a promise it will continue, and never use the ADX to time exits on fast reversals where its lag will leave you holding. Because it is strength without direction, it is a filter and a regime switch, telling a trend system to engage and a mean-reversion system to stand down, but it needs a separate signal for the which-way call. The two lookbacks, inner and outer, are real parameters that trade responsiveness against stability, and the ATR window must be set and lagged so it does not peek at the current bar, the same causality discipline the old ATR article demanded, or the tidy bounded line is quietly lookahead-poisoned.
KEY POINTS
- The ADX measures trend strength, not direction, so it pairs with a directional signal. Its raw material is the bar-to-bar change in highs and lows treated separately, not the close.
- Per bar, keep the larger of the up-movement and down-movement, zero the other, and zero both if the range did not expand, so the indicator reads range expansion rather than mere wiggle.
- It has two smoothing levels: an inner pass on the plus-movement, minus-movement, and ATR separately, then an outer pass on the final ratio. The name hides this and it is why the line is stable.
- Dividing each smoothed movement by ATR turns price-unit movements into regime-free, cross-instrument directional indicators, the literal payoff of the old ATR-normalization article.
- The ratio is total range expansion (DI+ plus DI-) in the denominator and how one-sided it was (absolute DI+ minus DI-) in the numerator, so it reads the fraction of expansion that pointed one way.
- It lags, worst at the end of sharp trends where it stays elevated after the move dies; use it as a strength filter and regime switch, not an exit timer, and keep the ATR window causal.